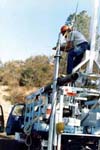
To better understand how the Earth's crust deforms near an earthquake, electronic instruments are used to measure a variety of physical changes in the Earth's crust. The instruments discussed below measure the deformation of the crust associated with the gradual buildup of elastic strain-energy which is, in turn, produced by the slow, relative movement of the Pacific and North American plates. The instruments at Parkfield measure this deformation at many points around the fault and at a variety of time-scales. Although the primary signal detected by many of these instruments is the steady strain accumulation due to plate motion, some theoretical models and small-scale laboratory measurements suggest that small parts of the fault may start to slip gradually prior to an earthquake. If such a process occurs before the expected Parkfield earthquake, the deformation networks there are expected to detect it.
Continuous and Campaign Global Positioning System (GPS)

Nine 3-component seismometers have been installed in boreholes near Parkfield, in cooperation with the University of California, Berkeley and Duke University, to provide high-gain, high-frequency records of magnitude -0.25 and larger shocks. A digital radio telemetry system (500 samples/second, 16-bit resolution) records the data from the borehole seismographs at a central site.
- Continuous and Campaign GPS Data
- Continuous GPS Data with additional process (Improves precision and resolution)
Geodolite
A network of 80 geodolite lines spanned the Parkfield region. Standard errors of individual line-length measurements ranged from 3-7 mm for lines 4-33 km in length. It was anticipated that at least part of the network will be measured annually. Four monitor lines near the southern end of the rupture zone were surveyed quarterly.
Borehole Strainmeter Network

Seven volumetric strainmeters (dilatometers) and three tensor strainmeters have been installed in the Parkfield area. The dilatometers are operated by the USGS in a cooperative effort by Carnegie Institution of Washington while the tensor instruments are operated by the USGS in cooperation with Commonwealth Scientific and Industrial Research Organization (CSIRO) of Australia. These instruments are installed in boreholes at depths of about 200 meters to minimize the effects of noise generated near the earth's surface. Unlike GPS and EDM, these instruments have can detect signals of 0.001 part-per-million (PPM) over 1-hour to 0.020 PPM over 1-week. In contrast, GPS and EDM are about 1000 less sensitive than borehole strain at these intervals. The tensor strainmeters have a powerful advantage of recording three components of strain allowing resolution of volume and two component of shear strain. Although the dilatometer records only volumetric strain, its has the advantage of recording data at seismic frequencies. With both instruments, the data are transmitted with digital telemetry by satellite to Menlo Park once every 10 minutes. Higher sampling rate for the dilatometers are made on-site and is retrieved manually from the field.
- More about dilatometers
- Continuous tensor strain data at CSIRO
- Dilatational strain data: Past 7 days | Past 30 days | Long-term plots
- Continuous tensor strain data at USGS: Past 7 days | Past 30 days
- Map of Instruments
Two-color Electronic Distance Measuring (EDM)

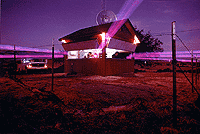
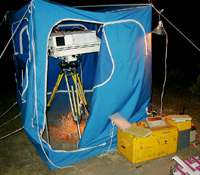
A distance-ranging network using an observatory-based two-color EDM was deployed in 1984 by the Cooperative Institution for Research in the Environmental Sciences (CIRES) at the University of Colorado and is now operated by USGS. The network consists of 18 baselines distributed radially around the central instrument site at Car Hill, just south of Parkfield. Under optimal conditions the network can be measured nightly. Initially, the network was measured 2-3 times per week, weather conditions permitting, but measurement schedule has been reduced to 2 to 3 times per month now that continuous GPS in being installed Typical standard errors of individual line length measurements are 0.5-0.7 mm for 4-6 km-long lines. Eleven of the lines were installed and the lengths measured in 1984. The full 18-line network was completed July 31, 1986.

In addition, a second network consisting of 20 baselines and spans the Middle Mountain section of the San Andreas fault is resurveyed by the two-color EDM once a year. Measurements commenced in late August 1986. Data from this network provide a measure of surface and shallow slip near Middle Mountain. The network features two instrument stations: LIME, located on Middle Mountain just east of the active fault trace; and PIG, located 2.5 km northeast of the San Andreas fault.
Water Well
Groundwater levels are monitored in 8 wells near Parkfield. Water level fluctuations in these wells can be indicators of rock deformation. Water-level fluctuations induced by the solid earth tides allow most of these wells to be "calibrated" as crustal deformation sensors. Groundwater pressure variations can also induce apparent variations of crustal strain which must be considered when interpreting data from other instruments such as borehole strainmeters. The wells range in depth from 30 m to 1000 m. At each site where the water level is below the ground surface, water level is measured using a submersible pressure transducer with a full-scale range of 5 psi and a resolution of about 0.001 ft of water. An atmospheric pressure sensor with a resolution of 0.01 millibar is also operated at most of the sites. Tipping bucket rain gages are operated at several sites as well. Water level, atmospheric pressure, and rain data are sampled at intervals of either 10 minutes or 15 minutes, depending on the site, and are transmitted to the USGS office in Menlo Park via satellite telemetry. Sites are powered by batteries recharged by solar panel.
- More about Water Level Monitors
- Water level data: Past 7 days | Past 30 days | Long-term plots
- Meteorlogical data: Past 7 days
- Map of Instruments
- Parkfield Research Results: Fluids
Creepmeter

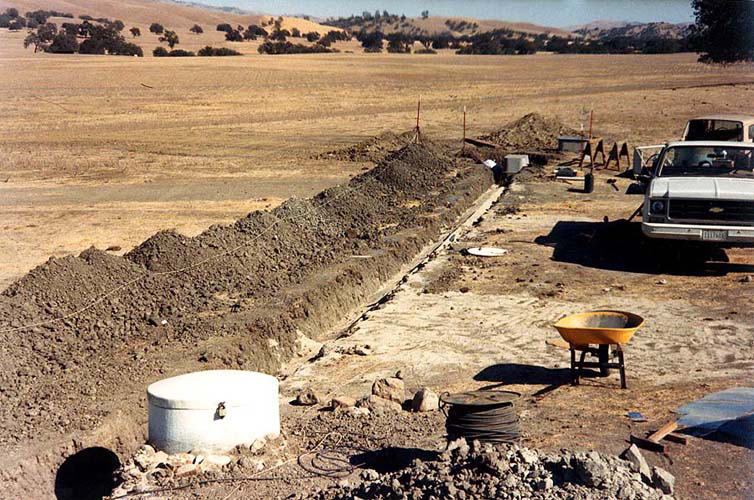
Thirteen creepmeters are located in the Parkfield area. The Middle Mountain creepmeter is located in the epicentral region of past Parkfield main shocks and foreshocks. Eleven of the creepmeters are invar-wire instruments with 0.02 mm resolution, and two and invar-rod instruments with 0.05 mm resolution. creep data are telemetered to Menlo Park every ten minutes via satellite and telephone telemetry.
- More about creepmeters
- Creepmeter data: Past 7 days | Past 30 days | Long-term plots
- Map of Instruments
 Jump to Navigation