September 28, 2004—M 6.0 earthquake captured
The Parkfield Experiment is a comprehensive, long-term earthquake research project on the San Andreas fault. Led by the USGS and the State of California, the experiment's purpose is to better understand the physics of earthquakes - what actually happens on the fault and in the surrounding region before, during and after an earthquake. Ultimately, scientists hope to better understand the earthquake process and, if possible, to provide a scientific basis for earthquake prediction. Since its inception in 1985, the experiment has involved more than 100 researchers at the USGS and collaborating universities and government laboratories. Their coordinated efforts have led to a dense network of instruments poised to "capture" the anticipated earthquake and reveal the earthquake process in unprecedented detail.
Hypothesis
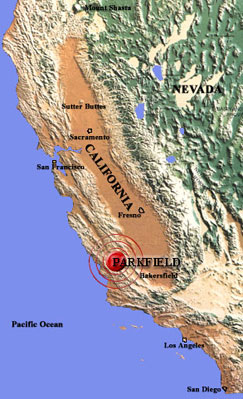
Moderate-size earthquakes of about magnitude 6 have occurred on the Parkfield section of the San Andreas fault at fairly regular intervals - in 1857, 1881, 1901, 1922, 1934, and 1966. The first, in 1857, was a foreshock to the great Fort Tejon earthquake which ruptured the fault from Parkfield to the southeast for over 180 miles. Available data suggest that all six moderate-sized Parkfield earthquakes may have been "characteristic" in the sense that they all ruptured the same area on the fault. If such characteristic ruptures occur regularly, then the next quake would have been due before 1993.
These pages describe the scientific background for the experiment, including the tectonic setting at Parkfield, the historical earthquake activity on this section of the San Andreas fault, the monitoring and data collecting activities currently being carried out, and plans for future research. Data are available to view in real-time and download.
Scientific Advances
While the greatest scientific payoff is expected when the earthquake occurs, our understanding of the earthquake process has already been advanced through research results from Parkfield. Some of the highlights are described.
Data
Real-time data from instrumentation networks running at Parkfield are available for viewing and downloading.
Parkfield Earthquake Shake Table Exhibit
The Art-Science of Earthquakes by D.V. Rogers
November 23, 2009 (video)
The exhibit was a geologically interactive, seismic machine earthwork temporarily installed in Parkfield in 2008. Rogers presented the history, conceptual premise, documentation of the work, and also put forward the idea of how early 21st century cultural practice could be used to encourage earthquake awareness and preparedness.
Lessons From the Best-Recorded Quake in History
USGS Public Lecture by Andy Michael
October 26, 2006 (video)
New data from the 2004 Parkfield earthquake provide important lessons about earthquake processes, prediction, and the hazards assessments that underlie building codes and mitigation policies.
Research Scientist: John Langbein, Earthquake Science Center.