The USGS has a cluster of instruments at Parkfield to measure changes prior, during and after a moderate sized (M6) earthquake. Parkfield is located on the San Andreas fault and the town is about half way between San Francisco and Los Angeles.
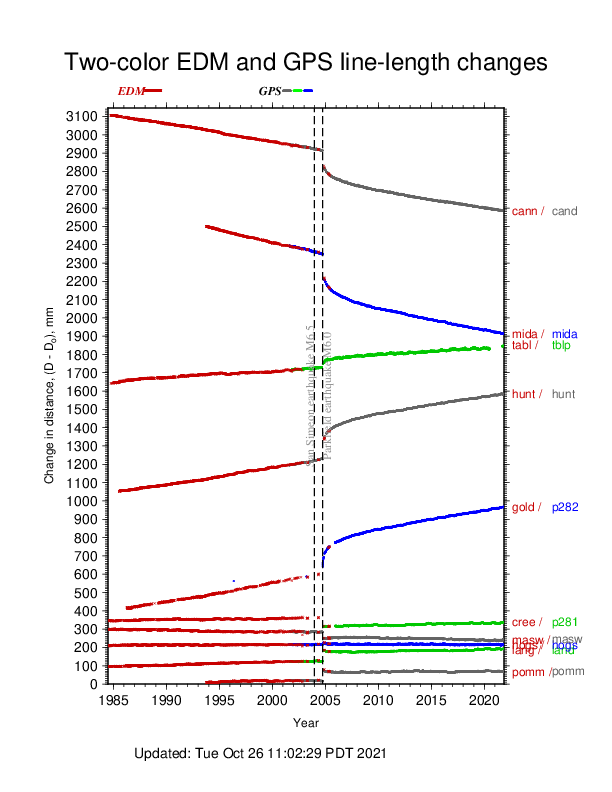
Note: The two-color EDM at Parkfield has been retired after 20 years of service. The last set of measurements were made in the spring of 2005. Monitoring the deformation at Parkfield is now being done with GPS. For continuity with the older EDM measurements, some of GPS measurements can be overlayed against the EDM data.
Plotting the data
The map shows the locations of baselines that are measured near Parkfield, California, using a two-color laser distance measuring instrument (EDM). The two-color EDM measures distances to a precision of 0.3 to 1.0 mm for ranges between 1 and 9 km. The locations of these baselines are shown in relation to the San Andreas fault and the location of the 1966 M6 Parkfield earthquake.
Plots of the changes in length of these frequently measured baselines can be shown. These baselines, which use the central station at CARR as a common end point, have been measured approximately 3 times each week since mid-1984.
Data since mid-1984
The baselines are color coded to indicate the relative stability of the end point monuments. RED indicates that the reflector end of the baseline is unstable in that it responds to a combination of local soil disturbances due to rainfall and the tectonic signal. BLUE indicates that the end of the baseline responds primarily to tectonic signals and these baselines are relatively free of contamination due to local soil disturbances. GREEN indicates that the baseline responds to local soil disturbances to a degree between RED and BLUE.
EDM and GPS line-length changes from 1984 to 2022
Description of data reduction
The observations of distance changes are contaminated by 3 sources: 1) short-term instrument instability; 2) localized movement of the central monument at CARR; and 3) localized movement at the remote reflector sites. The degree of localized monument instability at the remote sites is shown with the colors, but there is no attempt to adjust for these non-tectonic displacements. Since the other 2 instabilities are present in all data, estimates of these parameters are calculated and their effects are removed from the data.
Instrument instability appears to be a length proportional error which is best revealed with comparisons of distance changes between the Parkfield two-color EDM and a second two-color EDM. The instrument corrections shown in the plots were computed by: 1) for each baseline, removing the mean value, secular rate, and seasonal fluctuations; then 2) for each day where a sufficient number of baselines were measured, computing the average, residual line-length normalized to its length, which is termed the "instrument" adjustment"; and 3) adjusting the data by removing the effect of the "instrument adjustment" and adding back the secular rate, seasonal fluctuations and mean value. In the plots, the "Instrument adjustment" shown is for a 5 km long baseline.
The central monument at CARR is also unstable. Since distance measurements are made over the entire 360 degree arc, it is possible to track the position of the central monument with time. However, since some of the distant reflector monuments are noisy, too, only the distance changes from the most stable monuments are used to track the position of the central monument. Once the position of the central monument with time is computed, the data from all baselines are adjusted for the movement of the central monument.
For more details contact: John Langbein