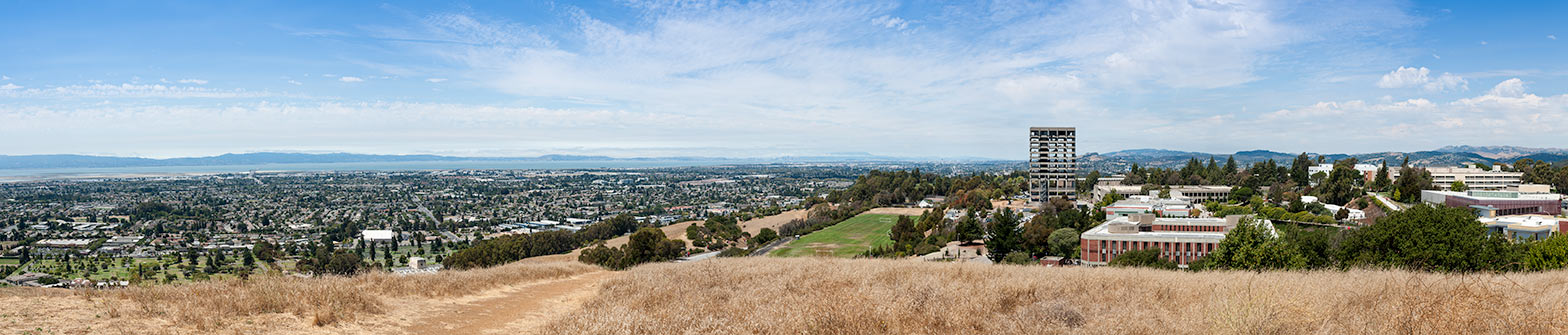
Before August 2013 Warren Hall towered above the California State University East Bay Campus, with the city of Hayward and San Francisco Bay in the valley below. The Hayward Fault runs along the base of the hills.
Map showing the deployment of hundreds of seismographs in the city of Hayward that the USGS used to record and observe the implosion of Warren Hall on the campus of California State University East Bay, Hayward.
California State University East Bay (CSU-EB) imploded Warren Hall in August of 2013, which was located near the active trace of the Hayward Fault. This implosion provided an excellent opportunity to use a “free” seismic source that was practically located on the Hayward Fault. 500 to 600 temporary seismographs were deployed in the Hayward area to capture the seismic signal generated by the implosion.
The effort was primarily a collaboration between CSU-EB and the USGS, but other organizations and agencies also conducted additional seismic investigations using the Warren Hall source. From the source, the USGS and CSU-EB recorded the seismic energy as it moved from the source along concentric circles. Because attenuation is generally greater with distance from the source, the concentric circles allowed scientists to measure the same theoretical amplitude (a) in the hard rock of the hills, (b) in the soft rocks/sediments of the valley, (c) within the fault zone, and (d) on the peaks, regardless of the source function. From these measurements, they compared the relative amplification effect of the various geologic terrains. The seismographs were densely spaced so that scientists could also look at the effect of relative amplification within each geologic terrain, which may help to explain why seismic energy can be stronger on one side of a street relative to the other side of the same street.
Along several of the radii extending from Warren Hall, scientists measured seismic velocities (Vp, Vs) in the hills, within the fault zone, and in the valley. These data are very useful in modeling expected ground shaking, and the data can help determine if there are additional faults east and west of the main surface trace. The regional earthquake-monitoring network of seismographs used to locate earthquakes in the Bay Area was turned on before the implosion to record the signal. From these data, scientists can determine how accurately the network located the implosion and provide correction factors, essentially providing a calibration for the network.
Photos
View of Warren Hall from Harder Rd.
Warren Hall pokes up above the hills of Garin/Dry Creek Pioneer Regional Parks.
The courtyard above the library is closed off before the implosion.
Mark Goldman, USGS Geophysicist, prepares a hole in a volunteer’s yard to place a seismometer.
Rufus Catchings, USGS Research Geophysicist, addresses the media at a volunteer’s home in the hills above Hayward. The geophones that attach to the seismometers (both a 3-component and a 1-component version) are visible in the photo.
Inside the Command Center at CSU-EB where the experiment was conducted.
USGS Visiting Scientists Jennifer Dreiling and Marius Isken deploy a seismometer near Warren Hall.
Jennifer Dreiling and Marius Isken consult their GPS and field notes.
USGS Visiting Scientist Jennifer Dreiling ensures the geophone is level.
Warren Hall memorabilia containing a piece of concrete from the building.
The beginning stage of the implosion of Warren Hall on August 17, 2013 at 9am.
The aftermath of the implosion, after the building collapsed.
Co-PIs (Principle Investigators) Luther Strayer, CSU-EB and Rufus Catchings, USGS congratulate each other after watching a high-speed video recording of the implosion moments after it occurred.
Workers begin cleaning up debris moments after the implosion of Warren Hall.
In the days following the implosion, demolition crews work to dismantle the remainders of the structure.
Nighttime shot of the aftermath from the roof of the library.
After the implostion, several stories of the western facade still remain.
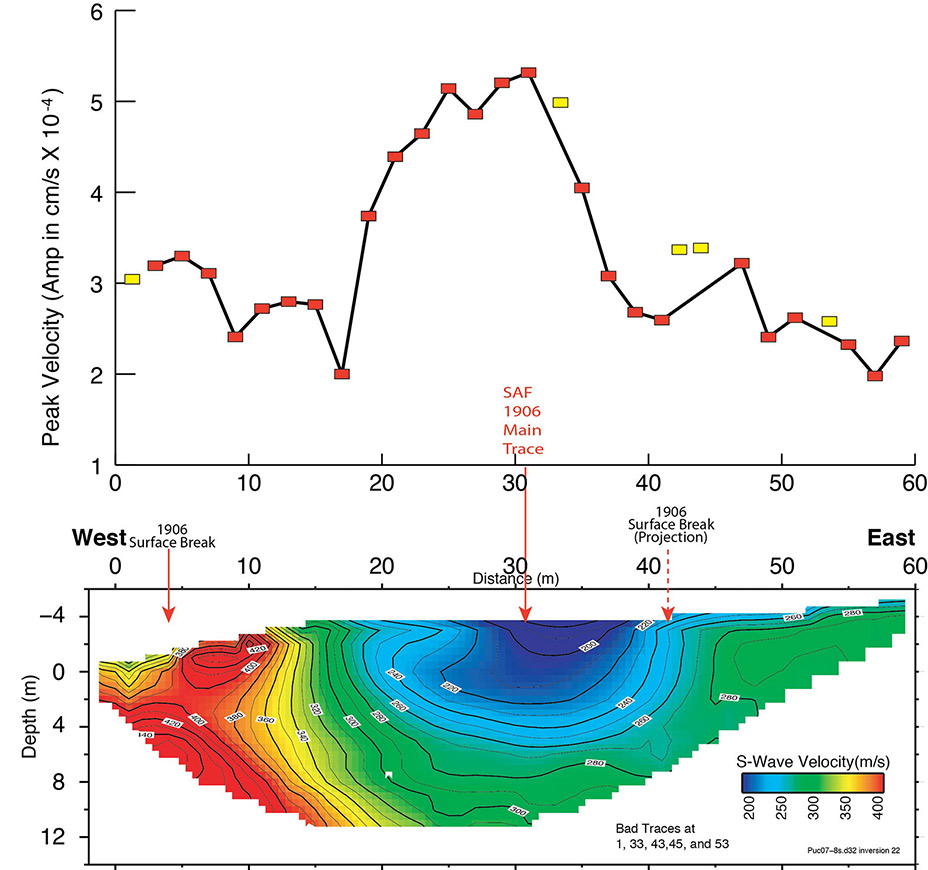
Example of amplification of seismic waves in fault zones
Example of amplification of seismic waves in fault zones.
(a) Plot of peak ground velocity (amplitude) as a function of distance across the San Andreas Fault. Note the high amplitudes centered over the San Andreas Fault.
(b) Cross section of seismic velocities across the San Andreas Fault. The main trace of the San Andreas Fault that ruptured in 1906 is located at about meter 31 of the seismic profile (see red arrow). Two other minor faults are shown at meters 4 and 41. Note the very low seismic velocities of material within the main fault zone relative to the areas to either side. Many other fault zones have shown similar amplification.