GOES Satellite
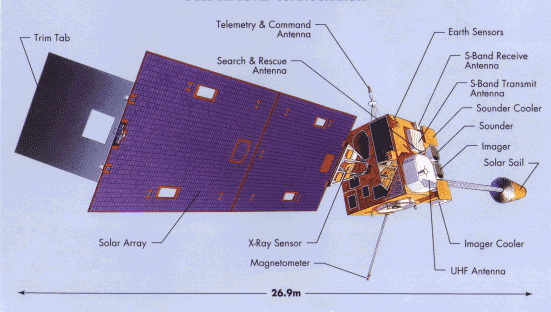
A Local Readout Ground Station (LRGS) located at the U.S. Geological Survey in Menlo Park, California is used to access geophysical data sent through the NOAA Geostationary Operational Environmental Satellite (GOES). The GOES satellite, orbiting the earth at approximately 23,000 miles, supports a radio relay system for low frequency data collection systems. The National Environmental Satellite, Data, and Information Service (NESDIS) operates the data collection portion of the GOES system.
Instrument sites located in fault zones and volcanic regions transmit data to GOES. Data transmitted from the remote sites are received from GOES by the NOAA Command and Data Acquisition Station (CDA) in Wallops, Virginia, by the GOES Data Collection System (DCS) and are retransmitted to a domestic communications satellite (DOMSAT). The data stream from the DOMSAT is received by the LRGS in Menlo Park and processed within seconds of being transmitted from the remote instrument location. Updates of data plots from the instruments are posted on the World Wide Web.
Data are transmitted from an instrument site every 10 minutes using either 16, or 22-bit digital telemetry. Removal of re-zeros, offsets, problems with telemetry and identification of instrument failures can be a difficult, tedious and time-consuming task. The data shown on these web pages have been edited and revised with human input with the exception of the most recent 24 to 48 hours. During special events, these can be edited as required.
For most of the strainmeter sites located in the SF Bay Area, these data are digitized with a 24-bit system at either 100 or 200 samples per second and those raw data are archived at UC Berkeley (ncedc.org link) in miniSeed format. For the data presented here, the raw data are decimated to 10-minute samples and are appended to the existing data collected using the GOES telemetry.
Data for the various low frequency instruments are automatically processed on a regularly scheduled basis — typically every 30 minutes. Plots are created using The Generic Mapping Tools (GMT) program.
The plots on this site should not be used for engineering, legal, or any other critical applications.
Every 10-minute data transmission is time tagged at time of receipt from the GOES satellite by a ground station in Wallops Island, Virginia. Although the time tag is within 2 seconds of the instrument transmit time, it does not indicate when the data samples were actually taken.
The timing of data sampling in the field is based on manually setting time in a data collection platform (DCP) at the field site. The clock internal to the DCP schedules subsequent data sampling through programming of the DCP. Because instrument sites may not be revisited for periods up to 6 months (or longer), drift of the DCP clock may cause timing of data sampling to vary from initial settings.
All low frequency data are stored, plotted, and distributed in Coordinated Universal Time (UTC) (formerly known as GMT, or Greenwich Mean Time). To provide a measure of consistency in the data archive system, data received during a given 10-minute time period are time tagged with the preceding, even 10-minute mark. Thus data received at 1056 UTC are tagged as 1050 UTC.
In most cases, due to the sampling frequency and the nature of the data, precise timing information is not required. If, however, timing issues are pertinent to a study, the responsible researcher should be contacted concerning more precise data sample timing.
The timing information on data plots and in data distributed from this site are not meant to reflect the most accurate timing information available. In general, time information should be taken as an approximation (within 10 minutes) of the time of actual data samples.