M 7.5 - 32 km SW of Tari, Papua New Guinea
- 2018-02-25 17:44:44 (UTC)
- 6.070°S 142.754°E
- 25.2 km depth
Finite Fault
- The data below are the most preferred data available
- The data below have been reviewed by a scientist
Scientific Analysis
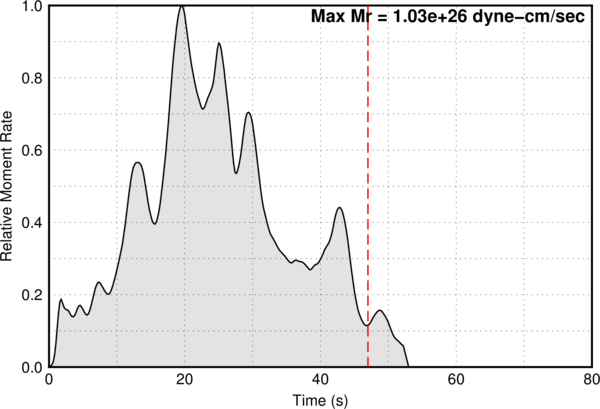
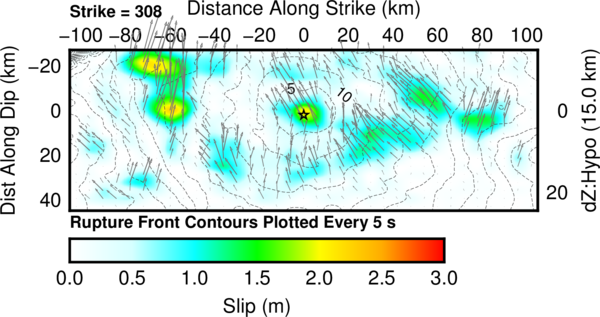
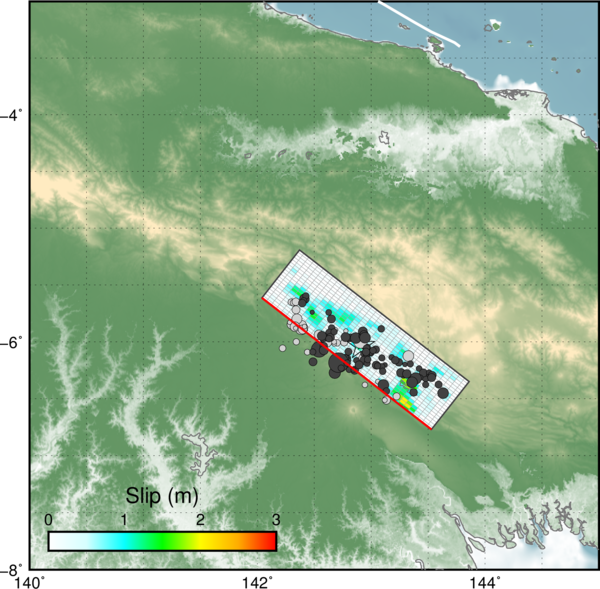
This updated finite fault model accounts for observations from InSAR that the rupture for this earthquake likely occurred on the NE-dipping plane of the moment tensor solution (as inferred to make more tectonic sense in our original solution). While interferograms show evidence for fault complexity, this is still a single fault model; it is difficult to perform a multi-plane FFM without information on potential orientations of other ruptured structures. There is evidence for a multi-fault rupture in this model - the source time function is quite complex, and the rake varies quite significantly across the fault plane. We thank Eric Bergman for performing the relocations shown in the basemap above, which seem to show a complementary pattern of aftershocks vs the slip distribution.
Data Process and Inversion
We analyzed 50 teleseismic broadband P waveforms, 22 broadband SH waveforms, and 89 long period surface waves selected based on data quality and azimuthal distribution. Waveforms are first converted to displacement by removing the instrument response and are then used to constrain the slip history using a finite fault inverse algorithm (Ji et al., 2002). We begin modeling using a hypocenter matching or adjusted slightly from the initial NEIC solution ( location = 6.0°S, 142.9°E; depth = 15.0 km ), and a fault plane defined using either the rapid W-Phase moment tensor (for near-real time solutions), or the gCMT moment tensor (for historic solutions).
Result
This result is based on the moment tensor nodal plane ( strike = 308.0°; dip = 33.0° ). The seismic moment release based upon this plane is 2.2e+20 N-m (Mw = 7.5) using a 1D crustal model interpolated from CRUST2.0 (Bassin et al., 2000).
Cross-section of Slip Distribution
Surface Projection
Moment Rate Function