
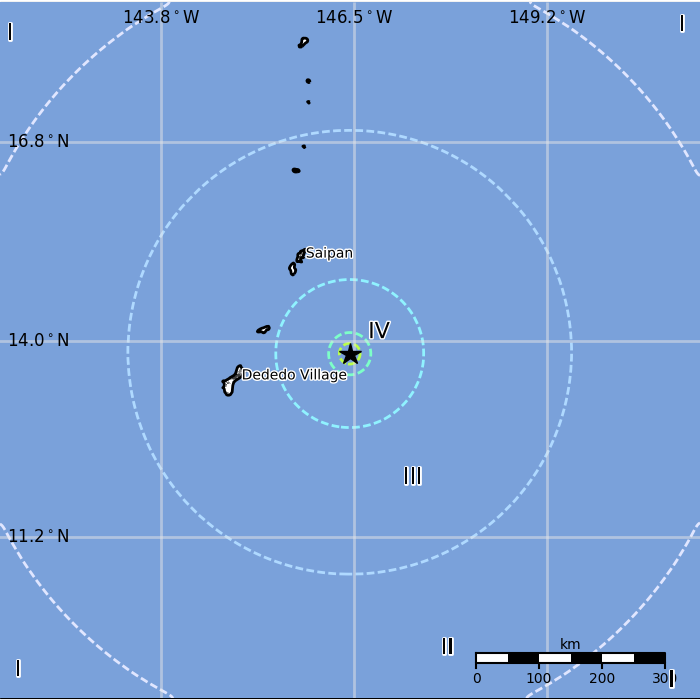
M 6.0 - 154 km SE of San Jose Village, Northern Mariana Islands
- 2018-02-11 23:14:15 (UTC)
- 13.821°N 146.438°E
- 10.0 km depth
PAGER
- The data below are the most preferred data available
- The data below have NOT been reviewed by a scientist.
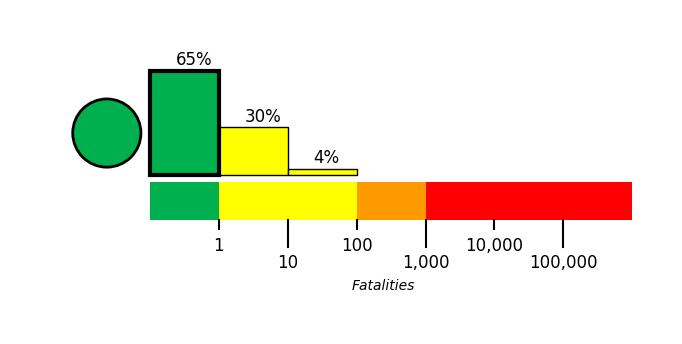
Estimated Fatalities
Estimated Economic Losses

Estimated Population Exposure to Earthquake Shaking
| MMI | Shaking | Population |
|---|---|---|
| Not Felt | 0 k* | |
| Weak | 223 k | |
| Light | 0 k | |
| Moderate | 0 k | |
| Strong | 0 k | |
| Very Strong | 0 k | |
| Severe | 0 k | |
| Violent | 0 k | |
| Extreme | 0 k |
*Estimated exposure only includes population within map area (k = x1,000)
Modified Mercalli Intensity (MMI) scale
Structure Information Summary
Overall, the population in this region resides in structures that are a mix of vulnerable and earthquake resistant construction. The predominant vulnerable building types are informal (metal, timber, GI etc.) and unknown/miscellaneous types construction.
Secondary Effects
Recent earthquakes in this area have caused secondary hazards such as landslides and liquefaction that might have contributed to losses.
| MMI | City | Population |
|---|---|---|
| San Jose Village | 15 k | |
| Talofofo Village | 3 k | |
| Inarajan Village | 3 k | |
| Merizo Village | 2 k | |
| Santa Rita Village | 8 k | |
| Umatac Village | 1 k | |
| Yigo Village | 21 k | |
| Dededo Village | 45 k | |
| Mangilao Village | 15 k | |
| Tamuning-Tumon-Harmon Village | 20 k |
From GeoNames Database of Cities with 1,000 or more residents (k = x1,000)