M 7.4 - 15 km S of Hualien City, Taiwan
- 2024-04-02 23:58:12 (UTC)
- 23.836°N 121.598°E
- 40.0 km depth
Finite Fault
- The data below are the most preferred data available
- The data below have been reviewed by a scientist
Scientific Analysis
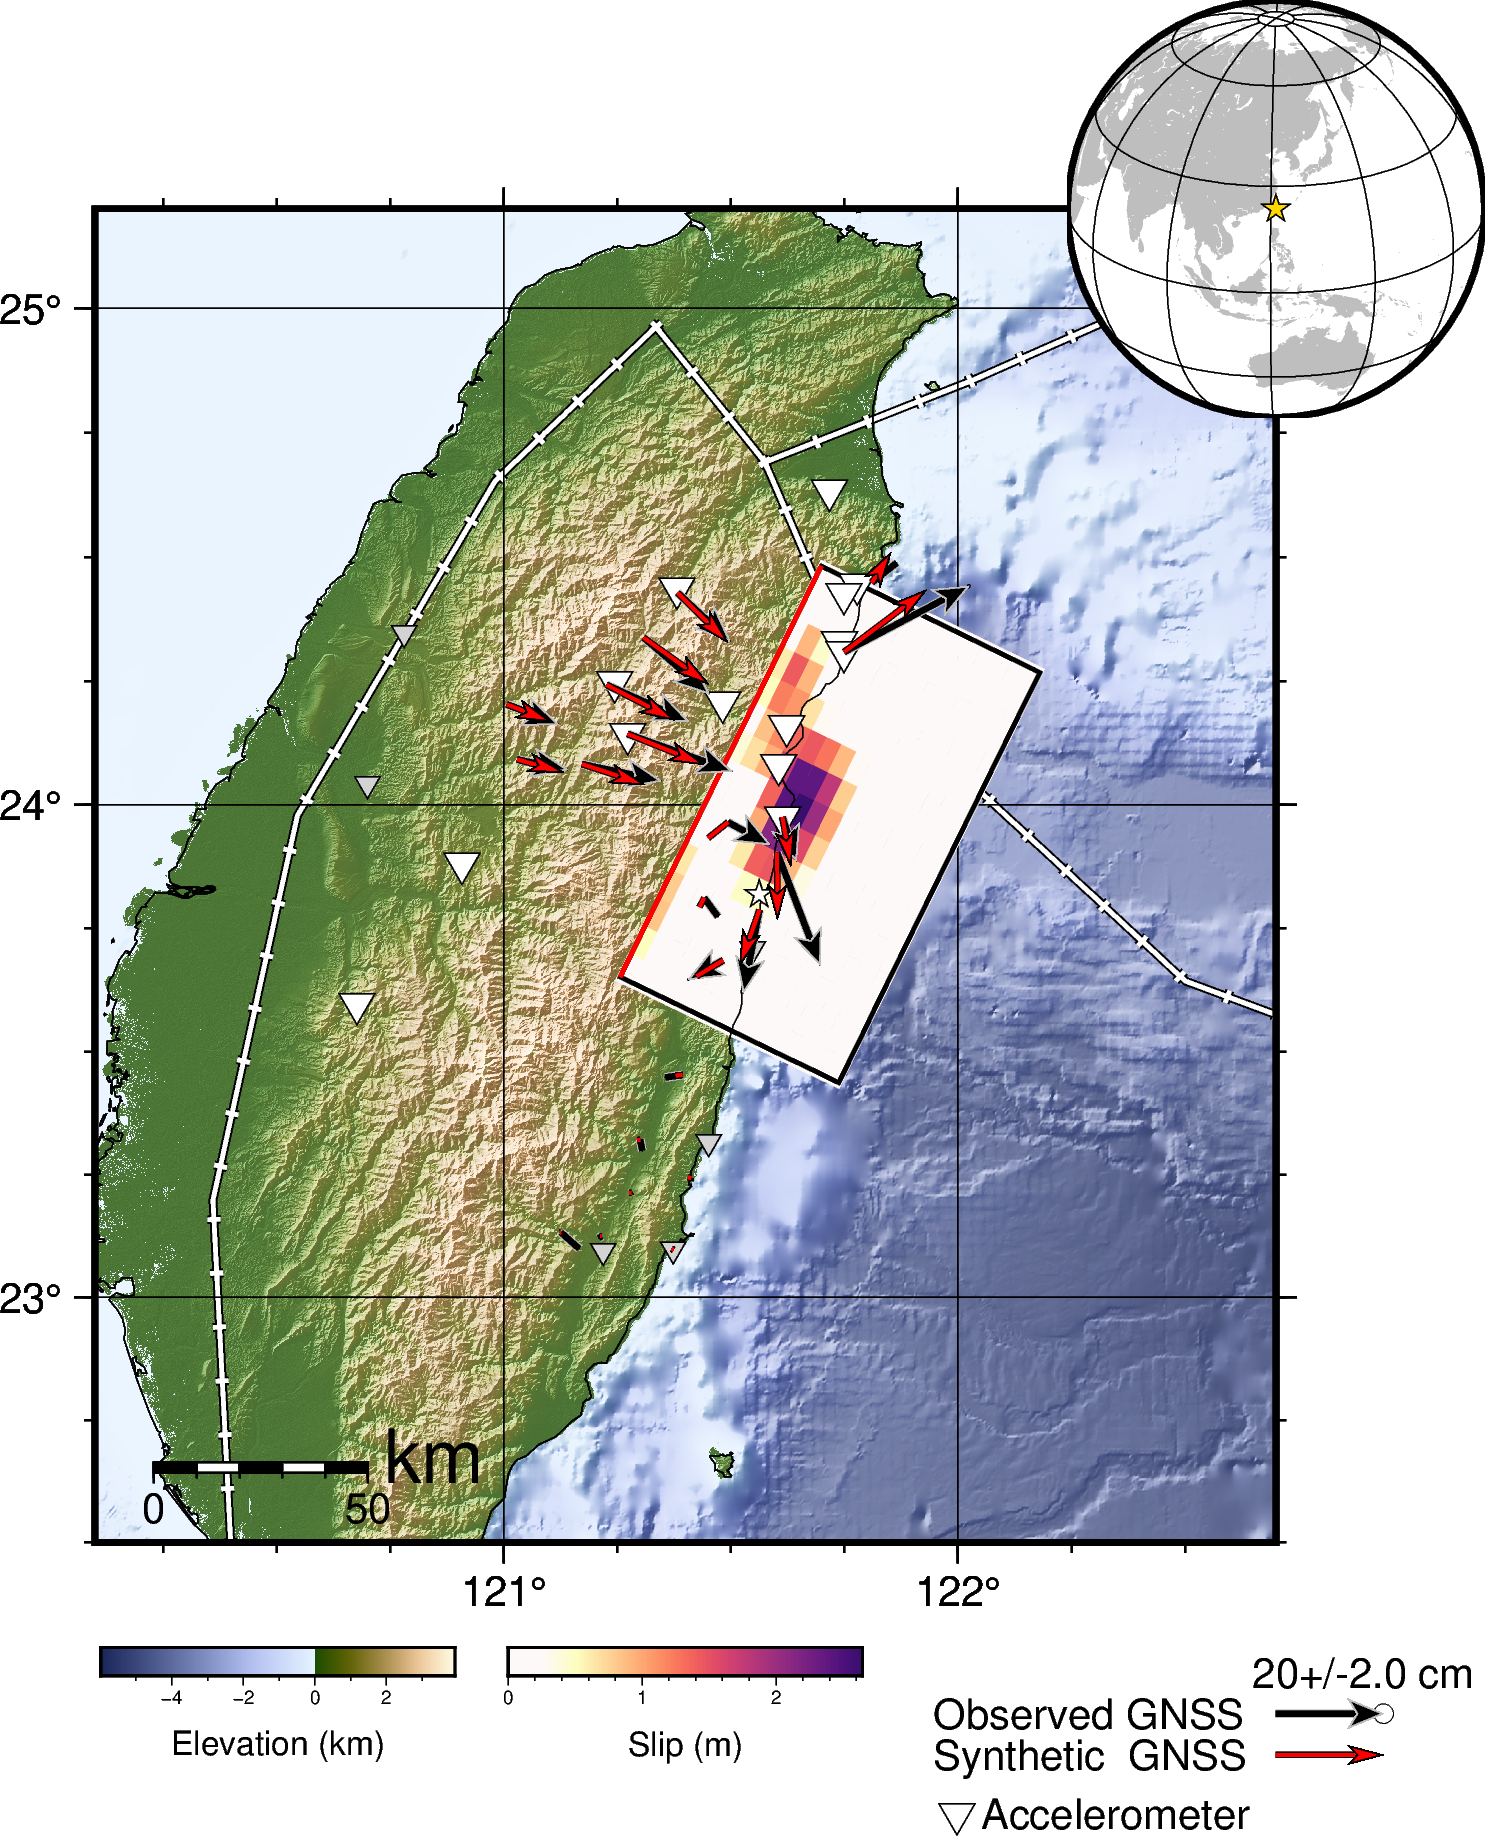
This finite fault model includes teleseismic observations as well as strong-motion accelerometer observations from the Broadband Array in Taiwan for Seismology network (TW) and static GNSS observations from the Central Weather Administration of Taiwan and processed by The Nevada Geodetic Laboratory. Please note that the static GNSS offsets may include contribution from the M6.4 event that occurred 13 minutes after the mainshock.
Data Process and Inversion
We analyzed 46 teleseismic broadband P waveforms, 29 broadband SH waveforms, and 60 long period surface waves selected based on data quality and azimuthal distribution. Waveforms are first converted to displacement by removing the instrument response and are then used to constrain the slip history using a finite fault inverse algorithm (Ji et al., 2002). We begin modeling using a hypocenter matching or adjusted slightly from the initial NEIC solution ( location = 23.8°N, 121.6°E; depth = 34.8 km ), and a fault plane defined using either the rapid W-Phase moment tensor (for near-real time solutions), or the gCMT moment tensor (for historic solutions).
Result
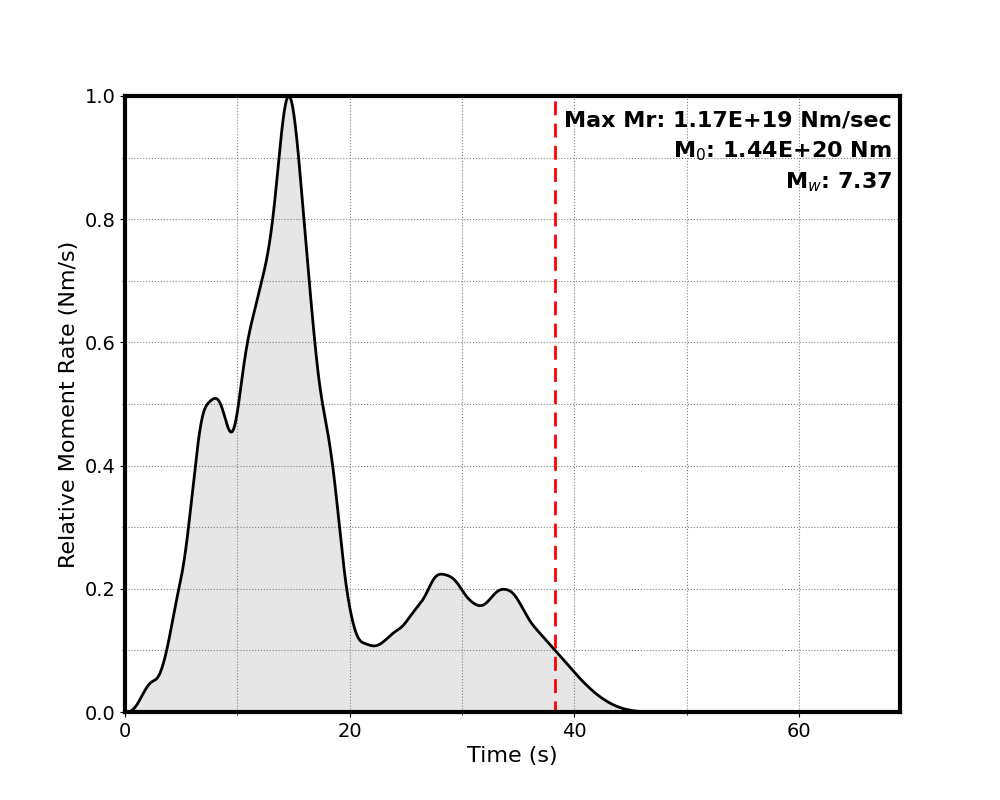
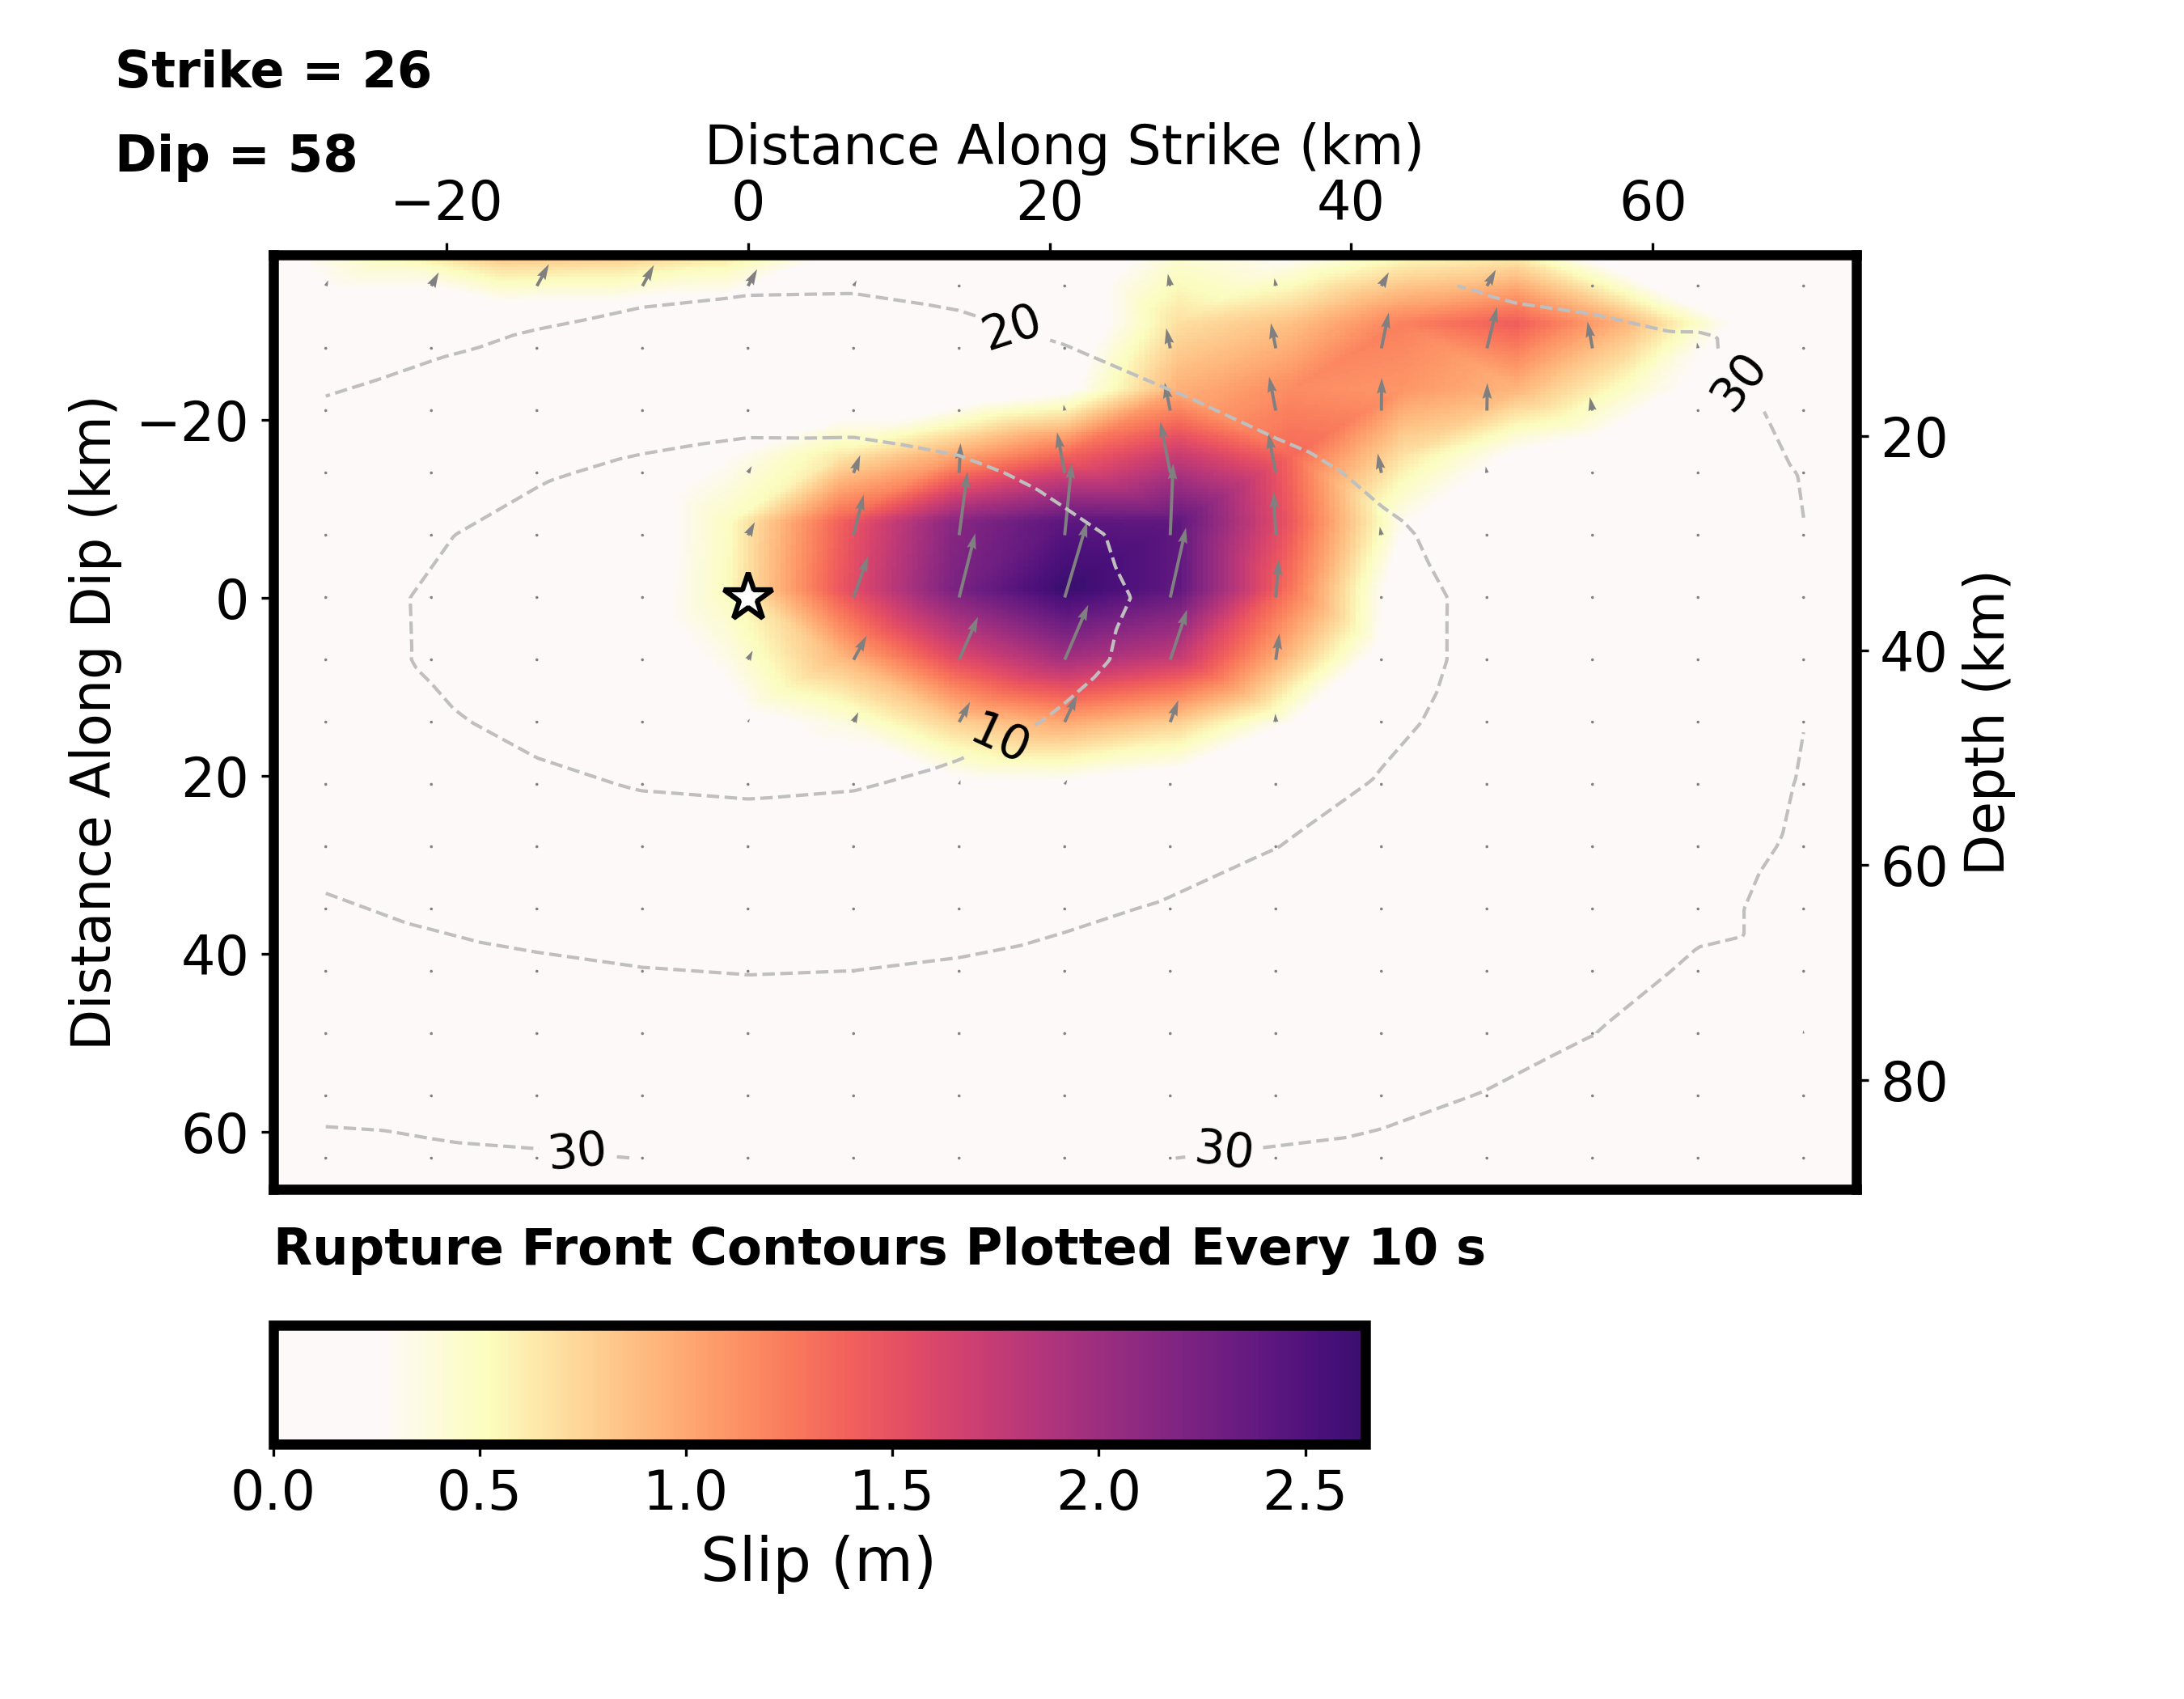
This result is based on the moment tensor nodal plane ( strike = 26.0°; dip = 58.0° ). The seismic moment release based upon this plane is 1.4e+20 N-m (Mw = 7.4) using a 1D crustal model interpolated from CRUST2.0 (Bassin et al., 2000).
Cross-section of Slip Distribution
Surface Projection
Moment Rate Function