Two important ingredients for computer simulations of ground motion are (1) a 3-D map of the earth materials through which the earthquake seismic waves pass and (2) a slip model of the rupture itself.
3D Geologic Map and Seismic Velocity Model
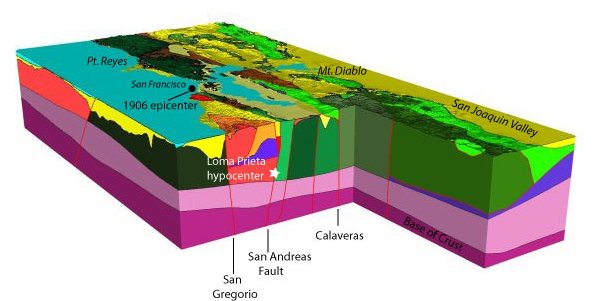
Oblique view, looking from the southwest toward San Francisco Bay. The corner of the 3D Geologic Model has been cut away to show faults (red lines), basins (yellow and gold), and other geologic rock units (various colors).
The pattern and amplitude of seismic waves and the intensity of shaking at a site depend on the characteristics of the earthquake and the geologic materials through which the seismic waves must pass from the fault to the site. A new 3-D Geologic Map and Seismic Velocity Model for Central California and the San Francisco Bay region was constructed in 2006 to provide the computer simulations with the properties of the earth materials. The model contains the material properties at over 300 million points spanning a region 400 miles by 205 miles and down to depths of 28 miles.
Soft materials, such as unconsolidated sedimentary deposits like bay muds and even sedimentary rocks, amplify the shaking. Consequently, locations situated over sedimentary basins or on unconsolidated sedimentary deposits can be especially susceptible to strong shaking. Faults are not only the sites of earthquakes but can also reflect seismic waves, sometimes resulting in focusing of waves at unexpected locations.
Slip Model
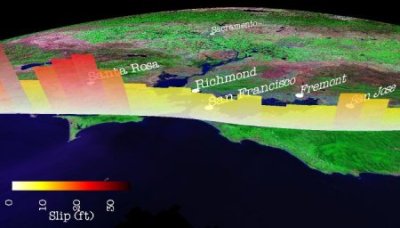
Total 1906 estimated slip for sections along the San Andreas Fault. The horizontal offset across the fault is given in feet.
A slip model provides a map of the slip on the fault surface as a function of time during the rupture. For past earthquakes, seismologists construct slip models based on the recorded ground motions and observations of the displacement as a result of the event. For example, a slip model of the 1906 earthquake was constructed from seismograms obtained at 96 locations around the world and geodetic surveys made before and after the earthquake. These surveys reveal the extent and magnitude of ground deformation caused by the earthquake.
The figure at the right shows the final amount of slip along sections of the fault in the San Francisco Bay region inferred from the seismograms and geodetic data. A similar figure showing the final slip along the entire length of the 1906 rupture also is also available.
Shaking Intensity in 1906
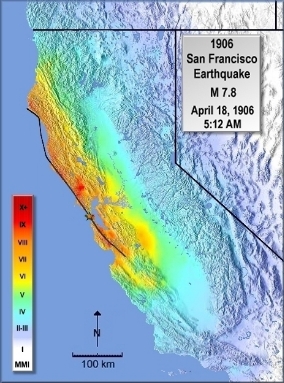
ShakeMap for 1906 constructed from felt reports.
The Lawson Report, published in 1908, describes in detail the shaking and damage observed at various sites in Central California during the 1906 earthquake. These descriptions have been recently re-evaluated in terms of modern intensity scales, and used to construct a ShakeMap for the event.
Felt observations are often used by seismologists to help fill in unknown information about the characteristics of earthquakes, especially historic events for which seismograms are non-existent or scarce. The computer simulations can provide quantitative and spatially comprehensive recreations of the shaking, but the computer results must be consistent with the felt observations if we are to have confidence in them. This need to validate the computer results against what was already know about the 1906 shaking intensity around the Bay region was the reason why it was important to re-evaluate the contemporary accounts.
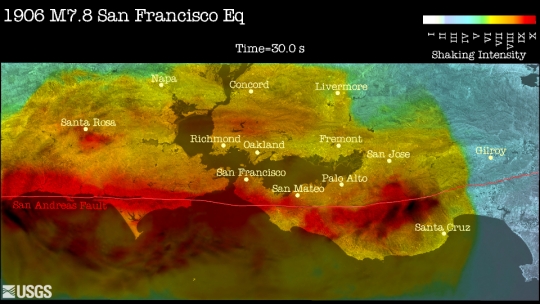
The bright red region about 70 km (40 miles) north-northwest of the epicenter (star) highlights the region around Santa Rosa which experienced intense and damaging shaking in 1906. Similarly intense shaking near Santa Rosa is also predicted by the computer model as can be seen in this snapshot or in the close-up movie for Santa Rosa.