Short Period Seismogram from the 1964 Alaska Earthquake
Station Code: DAL
Southern Methodist University
Dallas, Texas
Vertical-Component Benioff Seismometer
Magnification: 1,500
Start Time of Record: March 27, 1964, 17 hours, 39 minutes UTC
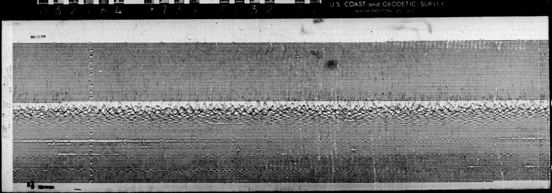
Time progress left to right and from top to bottom, just like text on a printed page.
Each line is 15 minutes long.
The hour marks are visible as a vertical stripe parallel to the left edge of the record.
Long Period Seismogram from the 1964 Alaska Earthquake
Station Code: DAL
Southern Methodist University
Dallas, Texas
Vertical-Component Sprengnether Seismometer
Magnification: 25,000
Start Time of Record: March 27, 1964, 17 hours, 39 minutes UTC
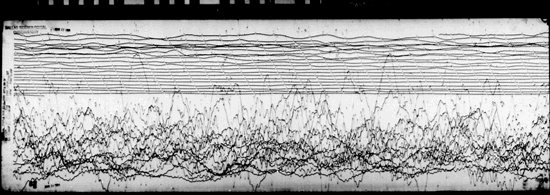
Each line is 30 minutes long.
The minute marks are visible as diagonal stripes on the upper half of the record.
The original records were made photographically with a light beam focused on a piece of photographic paper. When waves from the 1964 earthquake arrived the beam began moving back and forth so quickly that the photographic paper did not receive enough light to register the position of the trace. This situation continued for many hours following the earthquake, which is why the records above have a white band at the center.
Long Period Seismogram from the 1964 Alaska Earthquake
Station Code: COL
College, Alaska
Sprengnether seismometers
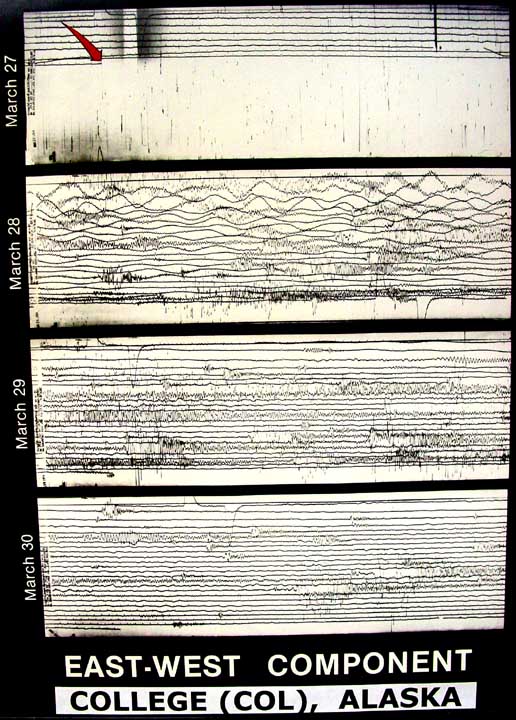
The seismograms reproduced above recorded east-west ground motion via a long-period Sprengnether seismometers and a sensitive galvanometer. Time progresses from left to right and from top to bottom, just like text on a printed page. Each line is 60 minutes long with a short vertical line identifying each minute. Component, magnification, date, and the beginning and ending time are noted on the left side of the each seismogram.
The original record was made photographically with a light beam focused on a piece of photographic paper. When waves from the 1964 earthquake arrived the beam began moving back and forth so quickly that the photographic paper did not receive enough light to register the position of the trace. This situation continued for many hours following the earthquake, which is why the record from March 27 shows little after the arrival of the P-wave at the red arrow.
Eventually the electrical current generated by the motion of the seismometer exceeded the capacity of the galvanometer and the galvanometer mirror reflecting the light beam became stuck in an extreme position until it was readjusted early the next day.