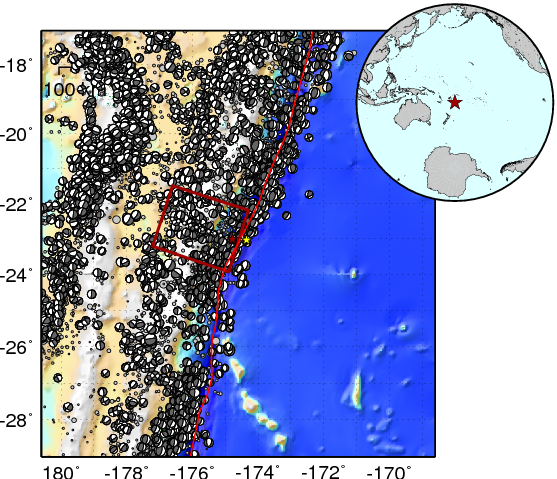
M 7.6 - 191 km S of ‘Ohonua, Tonga

  • 2009-03-19 18:17:40 (UTC)
  • 23.043°S 174.660°W
  • 31.0 km depth

Origin

Available Origin Products
CatalogMagnitudeTimeDepthReview StatusLocationSource

Moment Tensor

Available Moment Tensor Products
CatalogTensorMagnitudeDepth% DCSource

Finite Fault

Available Finite Fault Products
CatalogMagnitudeMaximum SlipSource

Focal Mechanism

Available Focal Mechanism Products
CatalogMechanismNodal Plane 1Nodal Plane 2Source

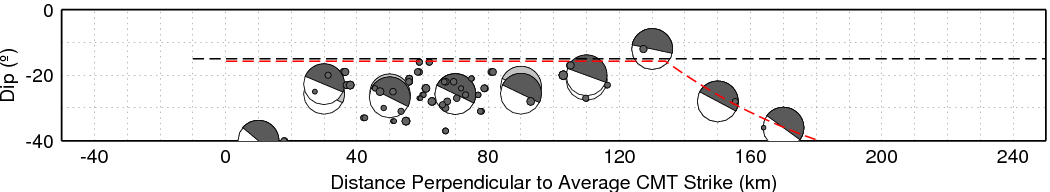
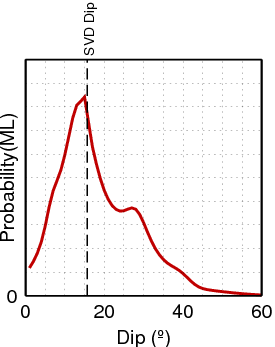
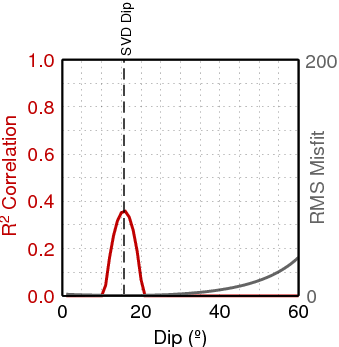
Subduction Zone Geometry Analysis

Most Likely Geometry: Strike = 198.34, Dip = 15.0
Most Likely Depth if on Planar Slab Interface = 14.98 km
Most Likely Depth if on Polynomial Slab Interface = 15.32 km

Basemap of subduction zone showing the area of the trench constrained in this example. Earthquake locations from the gCMT catalog and EHB catalog (gray circles, sized according to magnitude) are shown. Maroon rectangle indicates the area shown in cross section (c); all earthquakes within this area may be used to constrain trench geometry.
Variation in dip of best-fitting fault planes from the gCMT catalog for all events used to constrain trench geometry across the plane of the cross-section. Individual event dips are shown with small dark gray circles, sized with magnitude. Large mechanisms indicate the average dip in 20km bins across the plane of the cross-section. Light gray mechanisms represent a bulk average; dark gray represents a moment-weighted average.
Maximum Likelihood probability function describing interface dip probability over a range of dips from 0-60 degrees. Vertical black dashed line indicates the planar solution with an SVD inversion.
Least Squares R-squared correlation and RMS misfit functions describing interface dip likelihood over a range of dips from 0-60 degrees.

For More Information