
M 5.3 - 39 km NNE of Changling, China
- 2013-11-22 22:04:25 (UTC)
- 44.599°N 124.168°E
- 10.0 km depth
PAGER
- The data below are the most preferred data available
- The data below have NOT been reviewed by a scientist.
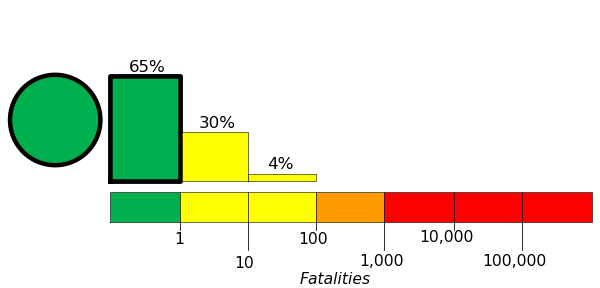
Estimated Fatalities
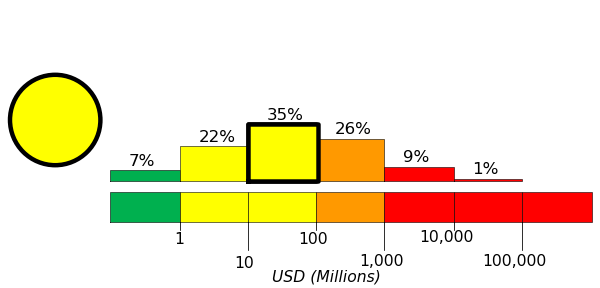
Estimated Economic Losses
Estimated Population Exposure to Earthquake Shaking

| MMI | Shaking | Population |
|---|---|---|
| Not Felt | 0 k* | |
| Weak | 14,941 k* | |
| Light | 2,262 k | |
| Moderate | 89 k | |
| Strong | 22 k | |
| Very Strong | 4 k | |
| Severe | 0 k | |
| Violent | 0 k | |
| Extreme | 0 k |
*Estimated exposure only includes population within map area (k = x1,000)
Modified Mercalli Intensity (MMI) scale
Structure Information Summary
Overall, the population in this region resides in structures that are highly vulnerable to earthquake shaking, though some resistant structures exist.
| MMI | City | Population |
|---|---|---|
| Changling | 56 k | |
| Qian'an | 0 k | |
| Qianguo | 114 k | |
| Nong'an | 0 k | |
| Kaitong | 63 k | |
| Fuyu | 139 k | |
| Baokang | 0 k | |
| Dalai | 93 k | |
| Dehui | 109 k | |
| Changchun | 2,537 k |
From GeoNames Database of Cities with 1,000 or more residents (k = x1,000)