
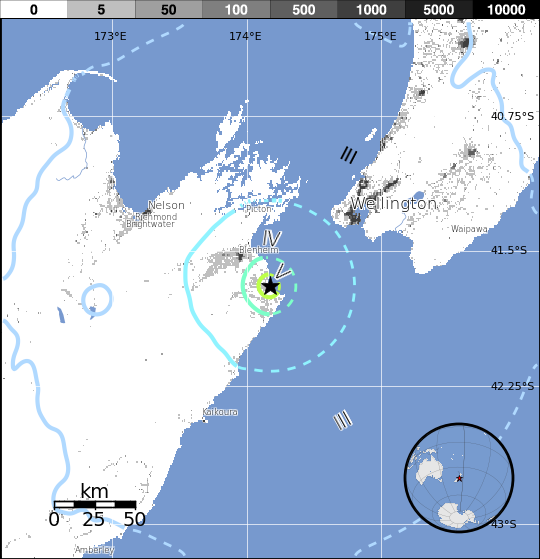
M 5.1 - 27 km SE of Blenheim, New Zealand
- 2013-08-16 03:51:35 (UTC)
- 41.695°S 174.174°E
- 19.4 km depth
PAGER
- The data below are the most preferred data available
- The data below have NOT been reviewed by a scientist.
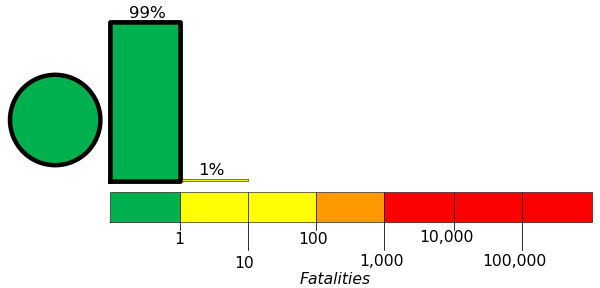
Estimated Fatalities
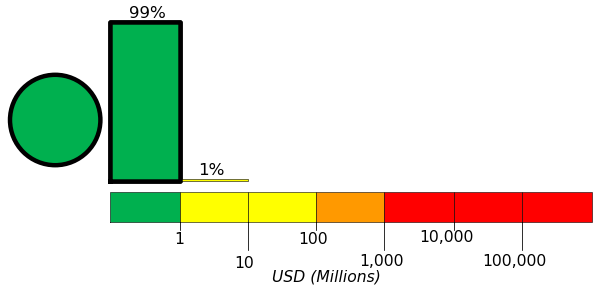
Estimated Economic Losses
Estimated Population Exposure to Earthquake Shaking
| MMI | Shaking | Population |
|---|---|---|
| Not Felt | 0 k* | |
| Weak | 742 k* | |
| Light | 41 k | |
| Moderate | 2 k | |
| Strong | 2 k | |
| Very Strong | 0 k | |
| Severe | 0 k | |
| Violent | 0 k | |
| Extreme | 0 k |
*Estimated exposure only includes population within map area (k = x1,000)
Modified Mercalli Intensity (MMI) scale
Structure Information Summary
Overall, the population in this region resides in structures that are resistant to earthquake shaking, though some vulnerable structures exist.
| MMI | City | Population |
|---|---|---|
| Blenheim | 27 k | |
| Picton | 3 k | |
| Brooklyn | 4 k | |
| Karori | 14 k | |
| Wellington | 382 k | |
| Kelburn | 4 k | |
| Richmond | 14 k | |
| Petone | 7 k | |
| Wakefield | 2 k | |
| Lower Hutt | 101 k |
From GeoNames Database of Cities with 1,000 or more residents (k = x1,000)