
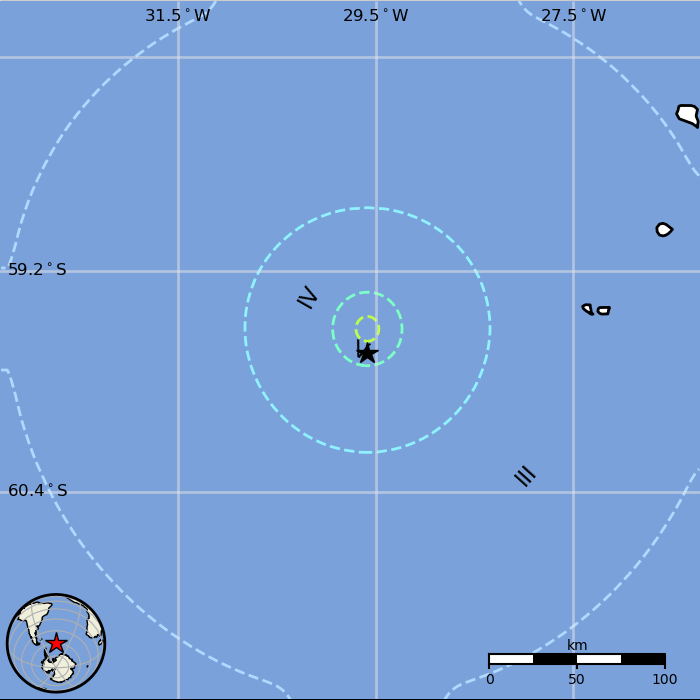
M 5.5 - South Sandwich Islands region
- 2024-06-05 10:39:15 (UTC)
- 59.669°S 29.589°W
- 10.7 km depth
PAGER
- The data below are the most preferred data available
- The data below have NOT been reviewed by a scientist.
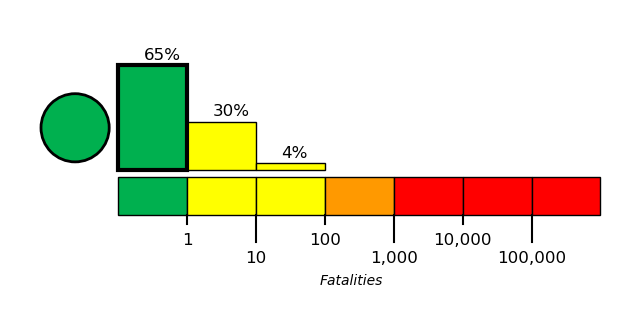
Estimated Fatalities
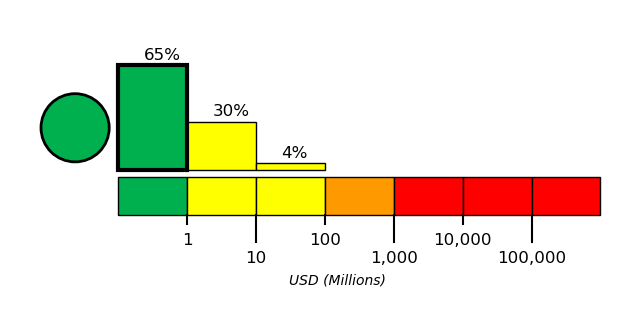
Estimated Economic Losses
Estimated Population Exposure to Earthquake Shaking
| MMI | Shaking | Population |
|---|---|---|
| Not Felt | 0 k* | |
| Weak | 0 k* | |
| Light | 0 k | |
| Moderate | 0 k | |
| Strong | 0 k | |
| Very Strong | 0 k | |
| Severe | 0 k | |
| Violent | 0 k | |
| Extreme | 0 k |
*Estimated exposure only includes population within map area (k = x1,000)
Modified Mercalli Intensity (MMI) scale
Structure Information Summary
Overall, the population in this region resides in structures that are a mix of vulnerable and earthquake resistant construction. The predominant vulnerable building types are adobe block with concrete bond beam and unreinforced brick with concrete floor construction.
No city exposure information available