
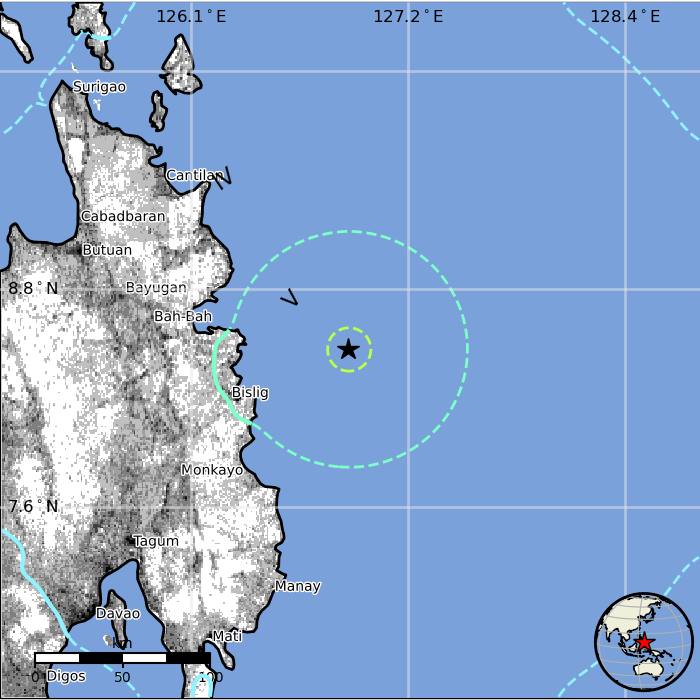
M 6.3 - 63 km ENE of Barcelona, Philippines
- 2023-12-02 18:09:25 (UTC)
- 8.440°N 126.939°E
- 46.4 km depth
PAGER
- The data below are the most preferred data available
- The data below have NOT been reviewed by a scientist.
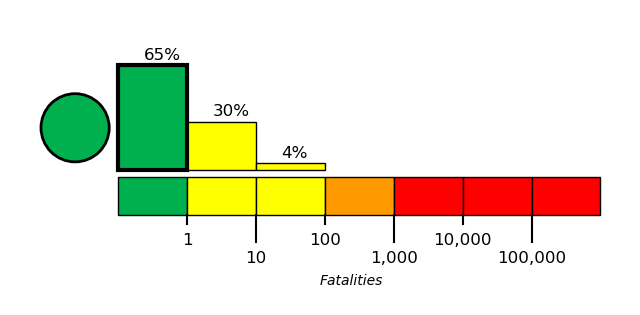
Estimated Fatalities
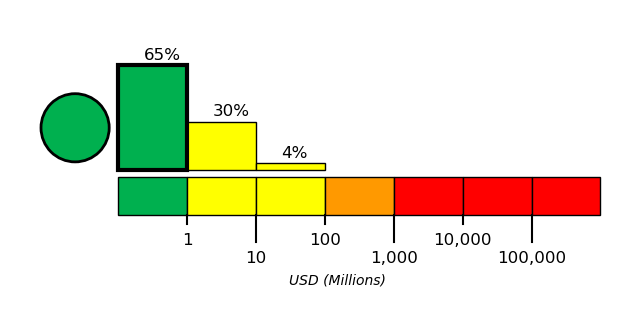
Estimated Economic Losses
Estimated Population Exposure to Earthquake Shaking
| MMI | Shaking | Population |
|---|---|---|
| Not Felt | 0 k* | |
| Weak | 508 k* | |
| Light | 7,705 k | |
| Moderate | 197 k | |
| Strong | 0 k | |
| Very Strong | 0 k | |
| Severe | 0 k | |
| Violent | 0 k | |
| Extreme | 0 k |
*Estimated exposure only includes population within map area (k = x1,000)
Modified Mercalli Intensity (MMI) scale
Structure Information Summary
Overall, the population in this region resides in structures that are a mix of vulnerable and earthquake resistant construction. The predominant vulnerable building types are unknown/miscellaneous types and heavy wood frame construction.
| MMI | City | Population |
|---|---|---|
| Hinatuan | 10 k | |
| Tidman | 3 k | |
| Barcelona | 4 k | |
| Bigaan | 3 k | |
| Bislig | 68 k | |
| Lingig | 6 k | |
| Butuan | 310 k | |
| Libertad | 250 k | |
| Magugpo | 233 k | |
| Davao | 1,213 k |
From GeoNames Database of Cities with 1,000 or more residents (k = x1,000)