
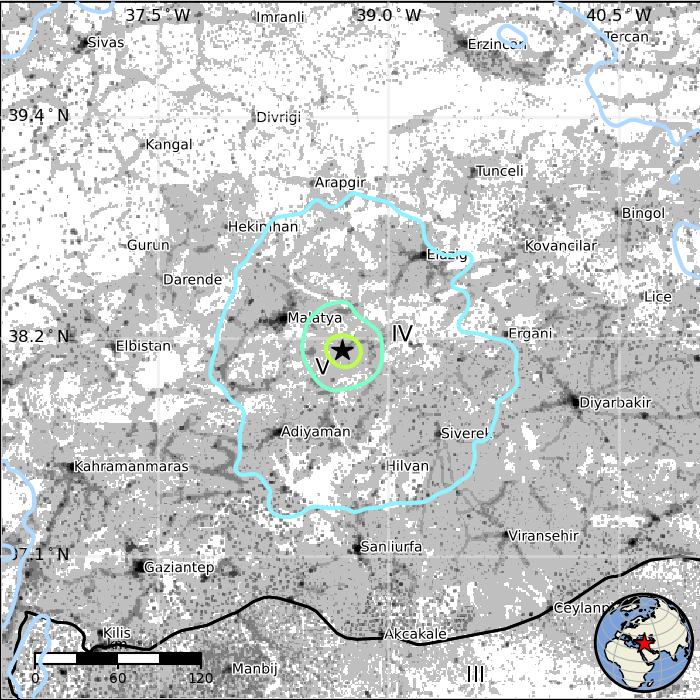
M 5.6 - 18 km NNE of Sincik, Turkey
- 2020-08-04 09:37:37 (UTC)
- 38.188°N 38.698°E
- 10.0 km depth
PAGER
- The data below are the most preferred data available
- The data below have NOT been reviewed by a scientist.
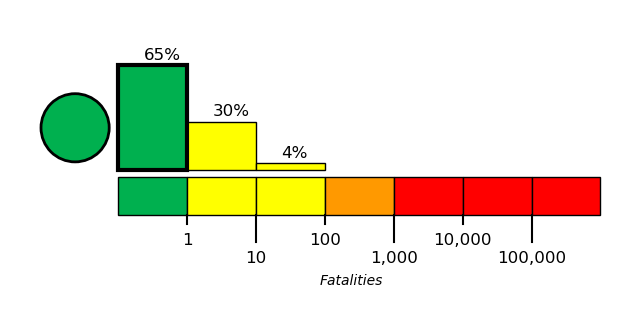
Estimated Fatalities
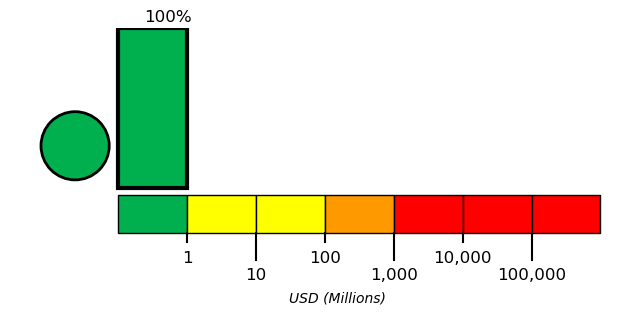
Estimated Economic Losses
Estimated Population Exposure to Earthquake Shaking
| MMI | Shaking | Population |
|---|---|---|
| Not Felt | 0 k* | |
| Weak | 12,088 k* | |
| Light | 2,388 k | |
| Moderate | 67 k | |
| Strong | 16 k | |
| Very Strong | 0 k | |
| Severe | 0 k | |
| Violent | 0 k | |
| Extreme | 0 k |
*Estimated exposure only includes population within map area (k = x1,000)
Modified Mercalli Intensity (MMI) scale
Structure Information Summary
Overall, the population in this region resides in structures that are a mix of vulnerable and earthquake resistant construction. The predominant vulnerable building types are adobe block and dressed stone/block masonry construction.
Secondary Effects
Recent earthquakes in this area have caused secondary hazards such as landslides that might have contributed to losses.
| MMI | City | Population |
|---|---|---|
| Tepehan | 0 k | |
| Puturge | 0 k | |
| Colakli | 0 k | |
| Sincik | 7 k | |
| Yarpuzlu | 0 k | |
| Kale | 0 k | |
| Malatya | 442 k | |
| Sanliurfa | 450 k | |
| Diyarbakir | 645 k | |
| Gaziantep | 1,066 k |
From GeoNames Database of Cities with 1,000 or more residents (k = x1,000)