
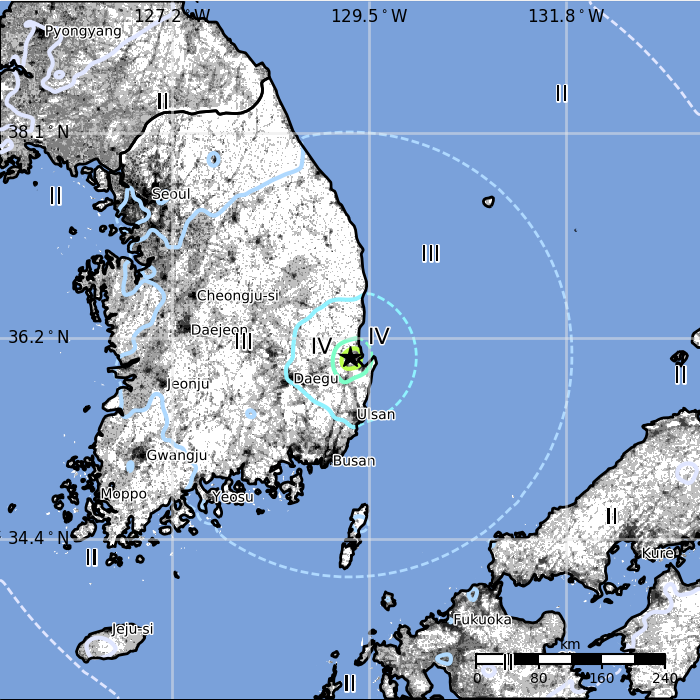
M 5.5 - 7 km SW of Heunghae, South Korea
- 2017-11-15 05:29:32 (UTC)
- 36.074°N 129.280°E
- 10.0 km depth
PAGER
- The data below are the most preferred data available
- The data below have NOT been reviewed by a scientist.
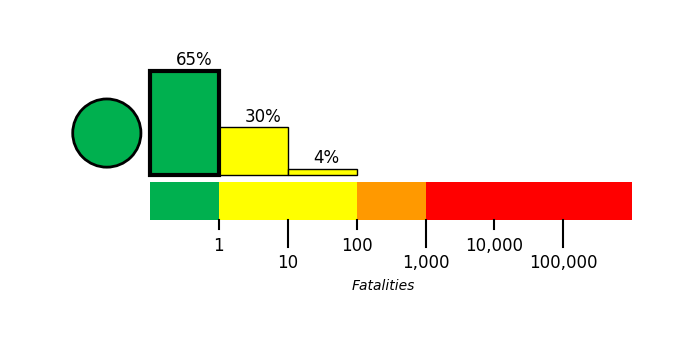
Estimated Fatalities
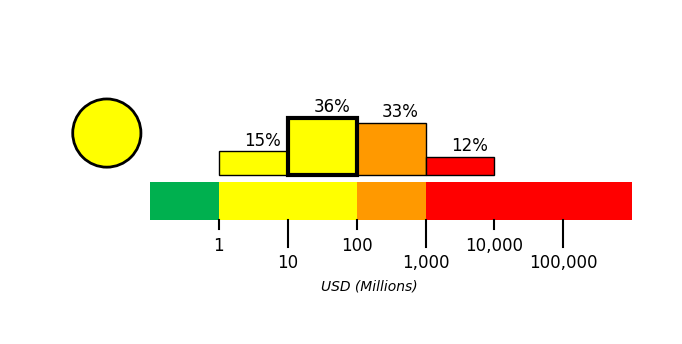
Estimated Economic Losses
Estimated Population Exposure to Earthquake Shaking
| MMI | Shaking | Population |
|---|---|---|
| Not Felt | 3,032 k* | |
| Weak | 68,074 k* | |
| Light | 3,607 k | |
| Moderate | 263 k | |
| Strong | 418 k | |
| Very Strong | 8 k | |
| Severe | 0 k | |
| Violent | 0 k | |
| Extreme | 0 k |
*Estimated exposure only includes population within map area (k = x1,000)
Modified Mercalli Intensity (MMI) scale
Structure Information Summary
Overall, the population in this region resides in structures that are a mix of vulnerable and earthquake resistant construction. The predominant vulnerable building types are heavy wood frame and reinforced/confined masonry construction.
Secondary Effects
Recent earthquakes in this area have caused secondary hazards such as landslides that might have contributed to losses.
| MMI | City | Population |
|---|---|---|
| Heunghae | 36 k | |
| Pohang | 500 k | |
| Yeonil | 41 k | |
| Singwang | 0 k | |
| Cheongha | 0 k | |
| Ocheon | 0 k | |
| Daegu | 2,567 k | |
| Busan | 3,679 k | |
| Incheon | 2,628 k | |
| Seoul | 10,349 k |
From GeoNames Database of Cities with 1,000 or more residents (k = x1,000)