
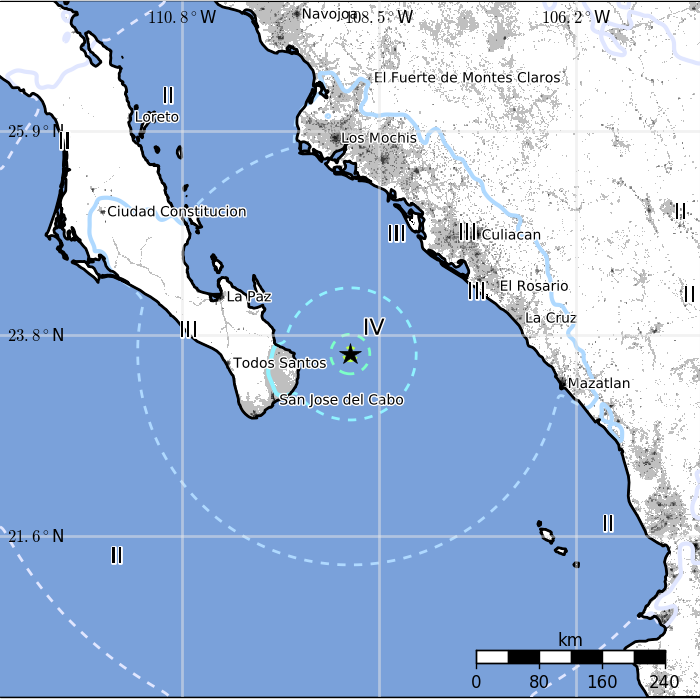
M 5.6 - 77 km E of La Rivera, Mexico
- 2017-09-22 05:33:43 (UTC)
- 23.548°N 108.831°W
- 10.0 km depth
PAGER
- The data below are the most preferred data available
- The data below have NOT been reviewed by a scientist.
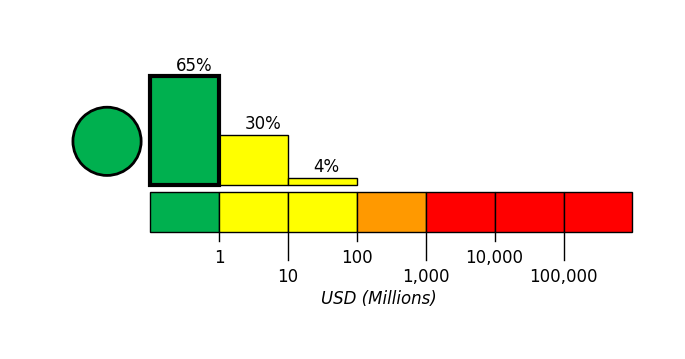
Estimated Fatalities

Estimated Economic Losses
Estimated Population Exposure to Earthquake Shaking
| MMI | Shaking | Population |
|---|---|---|
| Not Felt | 193 k* | |
| Weak | 5,694 k* | |
| Light | 56 k | |
| Moderate | 0 k | |
| Strong | 0 k | |
| Very Strong | 0 k | |
| Severe | 0 k | |
| Violent | 0 k | |
| Extreme | 0 k |
*Estimated exposure only includes population within map area (k = x1,000)
Modified Mercalli Intensity (MMI) scale
Structure Information Summary
Overall, the population in this region resides in structures that are a mix of vulnerable and earthquake resistant construction. The predominant vulnerable building types are mud wall and adobe block with concrete bond beam construction.
| MMI | City | Population |
|---|---|---|
| Las Veredas | 10 k | |
| San Jose del Cabo | 49 k | |
| La Playa | 1 k | |
| El Potrero de Sataya | 1 k | |
| Las Aguamitas | 2 k | |
| Dautillos | 2 k | |
| La Paz | 171 k | |
| Los Mochis | 215 k | |
| Mazatlan | 355 k | |
| Culiacan | 675 k |
From GeoNames Database of Cities with 1,000 or more residents (k = x1,000)