
M 4.1 - 3 km NNE of Little Creek, Delaware
- 2017-11-30 21:47:31 (UTC)
- 39.198°N 75.433°W
- 9.9 km depth
PAGER
- The data below are the most preferred data available
- The data below have NOT been reviewed by a scientist.
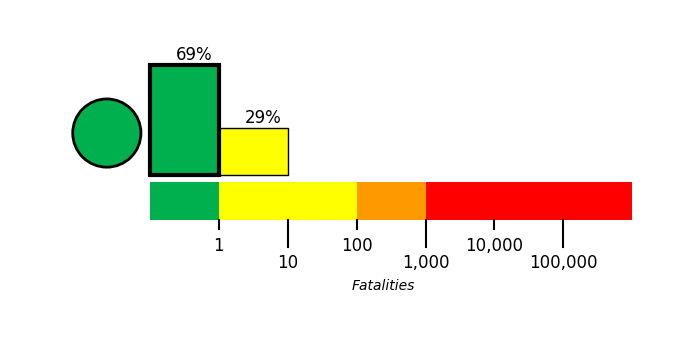
Estimated Fatalities
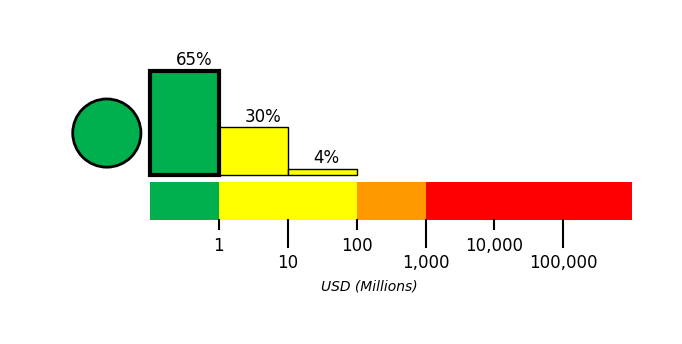
Estimated Economic Losses
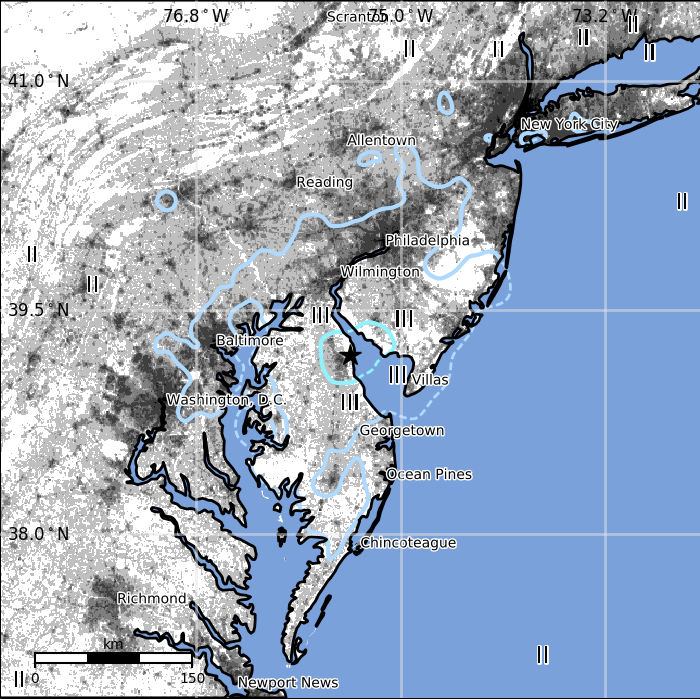
Estimated Population Exposure to Earthquake Shaking
| MMI | Shaking | Population |
|---|---|---|
| Not Felt | 12 k* | |
| Weak | 46,422 k* | |
| Light | 153 k | |
| Moderate | 0 k | |
| Strong | 0 k | |
| Very Strong | 0 k | |
| Severe | 0 k | |
| Violent | 0 k | |
| Extreme | 0 k |
*Estimated exposure only includes population within map area (k = x1,000)
Modified Mercalli Intensity (MMI) scale
Structure Information Summary
Overall, the population in this region resides in structures that are resistant to earthquake shaking, though vulnerable structures exist. The predominant vulnerable building types are unreinforced brick masonry and reinforced masonry construction.
| MMI | City | Population |
|---|---|---|
| Dover | 36 k | |
| Dover Base Housing | 3 k | |
| Rodney Village | 1 k | |
| Kent Acres | 2 k | |
| Highland Acres | 3 k | |
| Rising Sun-Lebanon | 3 k | |
| Trenton | 85 k | |
| Annapolis | 38 k | |
| Harrisburg | 50 k | |
| Washington, D.C. | 602 k |
From GeoNames Database of Cities with 1,000 or more residents (k = x1,000)