
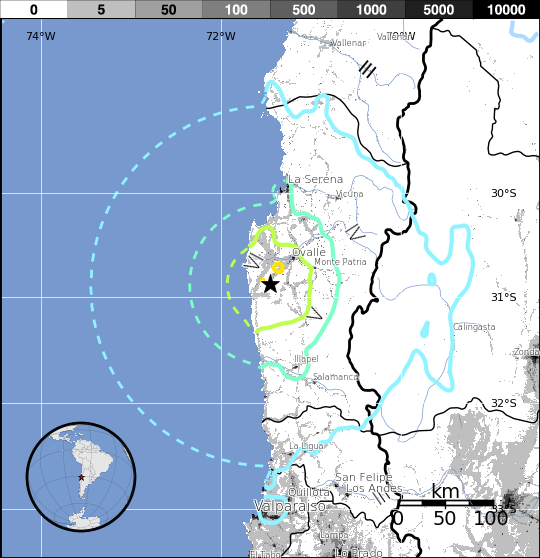
M 6.8 - 39 km SW of Ovalle, Chile
- 2015-11-07 07:31:43 (UTC)
- 30.880°S 71.452°W
- 46.0 km depth
PAGER
- The data below are the most preferred data available
- The data below have NOT been reviewed by a scientist.
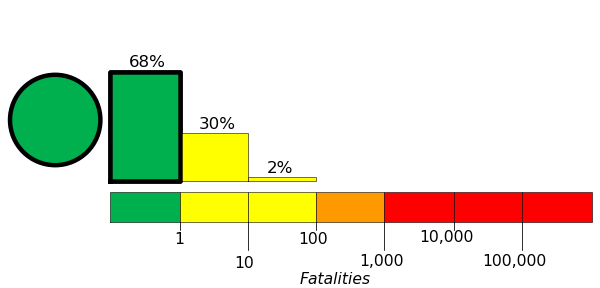
Estimated Fatalities
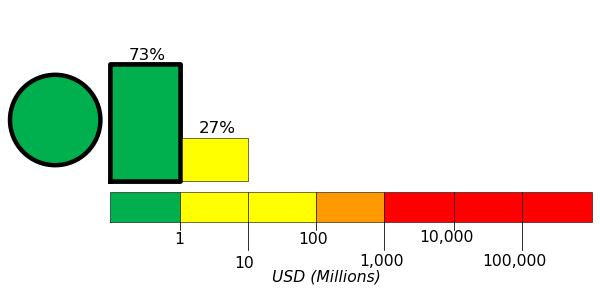
Estimated Economic Losses
Estimated Population Exposure to Earthquake Shaking
| MMI | Shaking | Population |
|---|---|---|
| Not Felt | 0 k* | |
| Weak | 3,847 k* | |
| Light | 1,772 k | |
| Moderate | 464 k | |
| Strong | 144 k | |
| Very Strong | 6 k | |
| Severe | 0 k | |
| Violent | 0 k | |
| Extreme | 0 k |
*Estimated exposure only includes population within map area (k = x1,000)
Modified Mercalli Intensity (MMI) scale
Structure Information Summary
Overall, the population in this region resides in structures that are resistant to earthquake shaking, though some vulnerable structures exist.
Secondary Effects
Recent earthquakes in this area have caused secondary hazards such as landslides and liquefaction that might have contributed to losses.
| MMI | City | Population |
|---|---|---|
| Ovalle | 77 k | |
| Monte Patria | 14 k | |
| Illapel | 23 k | |
| La Serena | 155 k | |
| Coquimbo | 161 k | |
| Vicuna | 13 k | |
| Salamanca | 13 k | |
| Villa Alemana | 97 k | |
| Quilpue | 130 k | |
| La Ligua | 25 k |
From GeoNames Database of Cities with 1,000 or more residents (k = x1,000)