Most large earthquakes are followed by additional earthquakes, called aftershocks, which make up an aftershock sequence. While most aftershocks are smaller than the mainshock, they can still be damaging or deadly. A small fraction of earthquakes are followed by a larger earthquake, in which case the first earthquake is referred to as a foreshock. For example, the 2011 M9.1 Japan earthquake and tsunami was preceded by a M7.3 foreshock two days before. When the M7.3 earthquake first occurred, it was called the mainshock, and then when the M9.1 earthquake occurred, that larger earthquake became the mainshock.
Following a significant earthquake, this aftershock forecast can provide situational awareness of the expected number of aftershocks, as well as the probability of subsequent larger earthquakes. Specifically, we forecast:
- the expected number of smaller aftershocks that may be felt (M3+ and M4+),
- the probability of aftershocks large enough to potentially do damage (M5+), and
- the probability of future moderate (M6+) to large (M7+) earthquakes.
We forecast aftershock activity over future time intervals of a day, a week, a month, and a year. We use the behavior of past aftershock sequences to forecast the likelihood of future aftershocks. As an aftershock sequence progresses, our forecast also incorporates information about the behavior of that specific sequence.
When We Make and Update Forecasts
Forecasts are posted for earthquakes of M4+ in the contiguous United States and M5+ in other U.S. states and territories. We also compute forecasts for some smaller earthquakes that are of particular public interest, for example earthquakes in densely populated areas. We will not usually compute aftershock forecasts for earthquakes that are themselves aftershocks of a prior larger earthquake, or for earthquakes that occur as part of known volcanic activity. Occasionally we post aftershock forecasts for significant international earthquakes that require an international humanitarian response.
Forecasts are updated regularly. The rate of aftershocks changes with time, generally decreasing, although sometimes temporarily increasing after a significant aftershock. Therefore, the forecasts are updated to keep current with the changing aftershock rate. We also update the forecasts over time to incorporate more information about the specific behavior of the aftershock sequence. The time that the current forecast was released, and the planned time of the next forecast update, are included in each forecast. Our standard update schedule can be found here: Schedule
How to Find the Forecasts
People can find the aftershock forecast for a specific earthquake by starting at the Overview (default) webpage for that earthquake and selecting the “card” titled “Aftershock Forecast.” This card will only appear if an aftershock forecast was computed for that event. The card displays a summary of the current forecast. Clicking on the card will take the user to the aftershock forecast.

At the top of the “Aftershock Forecast” page is an information box titled “Be Ready for More Earthquakes” with general aftershock information. It starts with the concept that larger earthquakes could follow and that aftershocks will be continuing for some time; and some safety information is included. This box can be collapsed using the “-” at the upper right. Below this information box are four tabs that give different views of the forecast information: “Summary”, “Commentary”, “Forecast Table”, and “Model Parameters”. Each of these tabs is discussed below.

Summary Tab: A Starting Point for Basic Information
The summary tab provides an interactive view of the aftershock forecast. Initially it displays the probability of aftershocks of different magnitudes for a default forecast duration. Radio buttons below the display allow the user to specify a magnitude and forecast duration. The “show all” selection for magnitude shows probabilities for all magnitudes, as in the initial view.
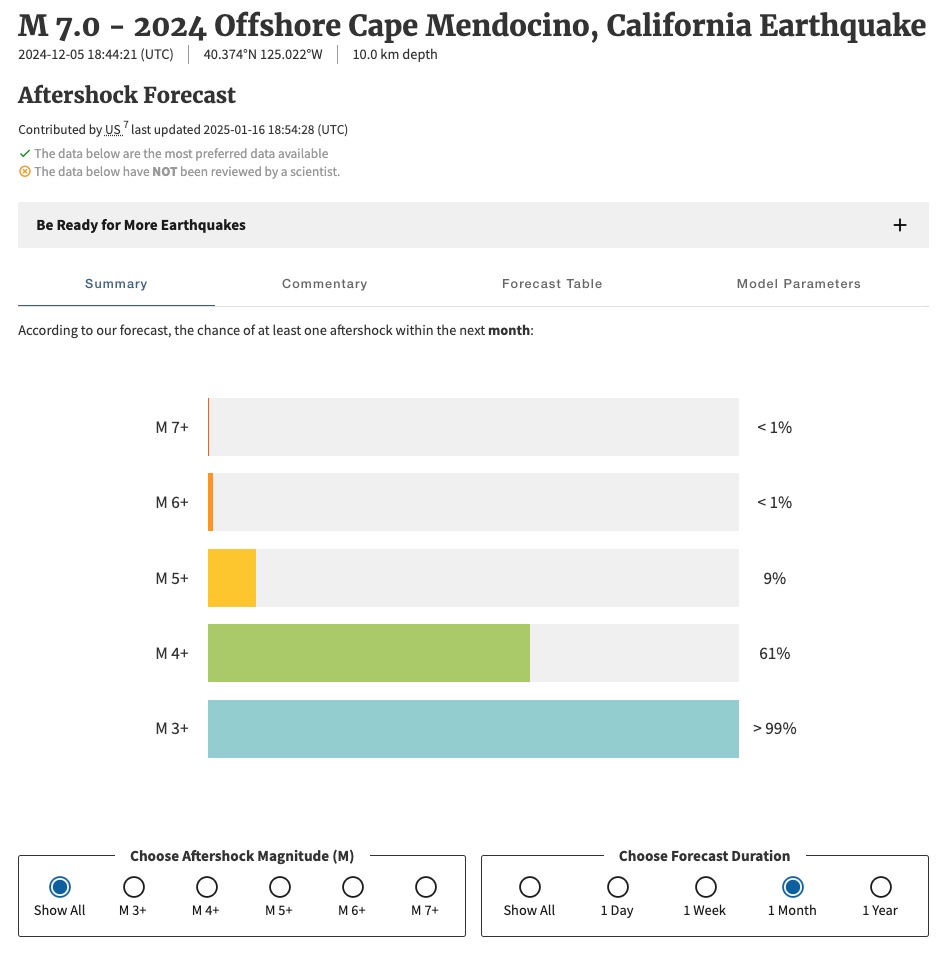
Selecting a single magnitude and single forecast duration, using the radio buttons below the display, displays both the probability of an aftershock of the given magnitude within the given time period, and the likely number of such aftershocks. The probability is visualized as an arc, with the fraction of the arc filled representing the probability out of 100%. Below that is a display of the probability distribution for the likely number of aftershocks.

Selecting a single magnitude and “Show All” for forecast duration displays the probability of an aftershock of the given magnitude over all four forecast durations. Note that while the rate of aftershocks generally goes down with time, the forecasts are larger for longer time intervals. Indeed, each time interval contains the one before (e.g. a one-year forecast includes the first day, first week, and first month) plus additional time.
Selecting “Show All” for both the aftershock magnitude and forecast duration reproduces the table that is also available under the “Forecast Table” tab.

Below the interactive graphics is a map showing the spatial region where the forecast applies, and the earthquakes that have occurred so far in that region. At this time, we are not calculating spatial forecasts or providing maps to show areas with the highest likelihood of aftershocks. As a rule of thumb, aftershocks are most likely to occur near the mainshock and in areas already experiencing numerous aftershocks.

Commentary Tab: Basic Information in Text Form
The Commentary tab describes the aftershock forecast in non-technical language, starting with a simple summary of the forecast, followed by what has already happened, and ending with a more quantitative version of the forecast.

Forecast Table Tab: Table Showing the Detailed Forecast
The Forecast Table tab presents the forecast as a table, covering a range of aftershock magnitudes and time frames. Many cells of the table show the probability of at least one aftershock above a certain magnitude and within a certain time frame. If the probability is high enough that more than one aftershock is likely to occur, the table instead shows the likely number of aftershocks above the given magnitude and within the given time frame.

Model Parameters Tab: Scientific Details
This tab shows what model was used to compute the forecast, as well as the model parameter values. Forecasts are currently made with either the Reasenberg-Jones (1989, 1994) model or the Epidemic-Type (ETAS) model (Ogata, 1988). There are three different types of parameter values:
- “generic” parameter values based on previous sequences in similar tectonic settings,
- “sequence-specific” parameter values fit to the aftershock sequence as of the time of the forecast, and
- “Bayesian” parameter values, which combine the generic parameter values with sequence-specific information.
How the Aftershock Forecasts Work
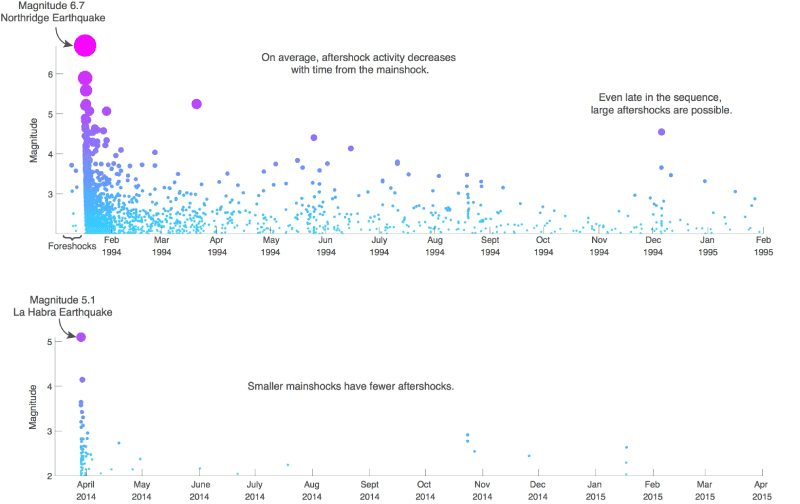
Our forecast is based on a statistical model of the behavior of past aftershock sequences in similar tectonic settings. The rate of aftershocks usually follows a few general rules:
- Larger mainshocks trigger more aftershocks than smaller mainshocks, and the aftershock productivity for a given mainshock magnitude also varies between tectonic regions. For instance, mainshocks along the San Andreas fault in California generally produce fewer aftershocks than mainshocks of the same magnitude where the Pacific plate collides with and subducts under Alaska.
- The rate of aftershocks decreases with time, such that the earthquake rate is roughly inversely proportional to the time since the mainshock. In other words, there are about 10 times as many aftershocks on the first day as on the tenth day.
- The magnitudes of the aftershocks do not get smaller with time, only their rate changes.
The initial forecast after an earthquake occurs is calculated using parameters that worked for previous earthquakes in that region or similar regions around the world. As time goes by and we observe how many aftershocks are happening, we use parameters that are a combination of the initial parameters and parameters determined from the current sequence of earthquakes.
The initial forecast uses only the mainshock magnitude, and therefore can be released soon after the mainshock, and before many aftershocks have occurred. Because the initial forecast depends a lot on the mainshock magnitude, we wait at least 20 minutes after the event occurs before issuing a forecast, to allow the preferred mainshock magnitude to stabilize.