PAGER–Rapid Assessment of an Earthquake's Impact (USGS Factsheet 2010-3036)
PAGER (Prompt Assessment of Global Earthquakes for Response) is an automated system that produces content concerning the impact of significant earthquakes around the world, informing emergency responders, government and aid agencies, and the media of the scope of the potential disaster. PAGER rapidly assesses earthquake impacts by comparing the population exposed to each level of shaking intensity with models of economic and fatality losses based on past earthquakes in each country or region of the world. Earthquake alerts – which were formerly sent based only on event magnitude and location, or population exposure to shaking – now will also be generated based on the estimated range of fatalities and economic losses.
The U.S. Geological Survey's National Earthquake Information Center (NEIC), located in Golden, Colorado, reports over 30,000 earthquakes a year. Tragically about 25 of these cause significant damage, injuries, or fatalities. The U.S. Geological Survey (USGS) often detects earthquakes well before eyewitness reports are available. It must then decide rapidly whether Federal and international agencies should be alerted to a potentially damaging event. In the past, the USGS primarily relied on the experience and intuition of its on-duty seismologists to estimate the impact of an event. To improve the accuracy of the assessment, the USGS has developed PAGER, an automated system for rapidly estimating the shaking distribution, the number of people and settlements exposed to severe shaking, and the range of possible fatalities and economic losses. The estimated losses trigger the appropriate color-coded alert, which determines the suggested levels of response: no response needed (green), local/regional (yellow), national (orange), or international (red).
In addition to direct alert notifications, PAGER provides important supplementary information, including comments describing the dominant types of vulnerable buildings in the region, exposure and any fatality reports from previous nearby earthquakes, and a summary of regionally specific information concerning the potential for secondary hazards, such as earthquake-induced landslides, tsunami, and liquefaction.
PAGER results are generally available within 30 minutes of a significant earthquake, shortly after the determination of its location and magnitude. However, information on the extent of shaking will be uncertain in the minutes and hours following an earthquake and typically improves as additional sensor data and reported intensities are acquired and incorporated into models of the earthquake's source. Users of PAGER exposure estimates should account for uncertainty and always seek the most current PAGER release for any earthquake (see Disclaimer).
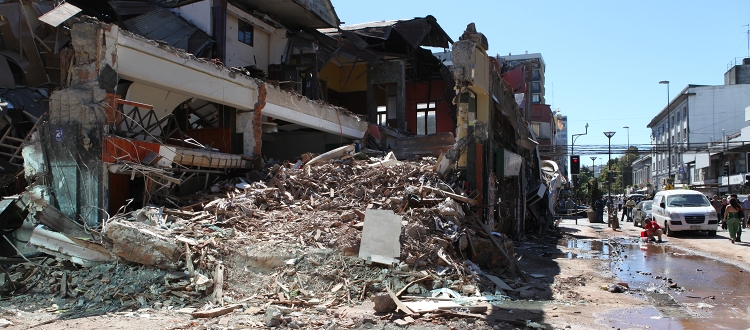
This information is available on this website and as a printable, one-page report (for example, this report on a damaging earthquake in Chile) with accompanying description. Fundamental to such a system, the USGS operates a robust computational and communication infrastructure necessary for earthquake response.
The PAGER Process
At the heart of the PAGER system are the timely and accurate earthquake location and magnitude determinations that the USGS has been producing for decades. PAGER uses these earthquake parameters to calculate estimates of ground shaking by using the methodology and software developed for ShakeMap. The number of people exposed to various levels of shaking is then calculated by combining the maps of predicted ground shaking with Oak Ridge National Laboratory's Landscan global population database. Finally, PAGER generates estimates of the ranges of potential fatalities and economic losses based on country-specific loss models that account for differences in construction practices and building vulnerabilities around the globe. In addition, the PAGER system estimates potential for earthquake-induced landslides, and, if available, damage and fatality reports from previous nearby historic earthquakes for comparison purposes.
Using the estimates of population exposure and the vulnerability of the local infrastructure, PAGER determines the scope of the catastrophe and issues alerts to emergency responders, government agencies, and the media. PAGER is an interactive system. As subsequent information becomes available, more accurate maps of ground shaking are produced, refined estimates of population exposures are made, and updated alerts are issued, if necessary.
Steps in the PAGER Process
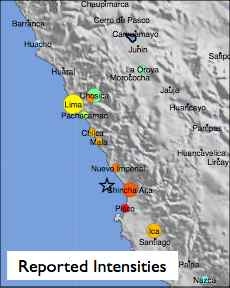
- After the magnitude and hypocenter of an earthquake are determined, Global ShakeMap retrieves any strong ground motion data and intensities reported by people in the epicenteral region via the online USGS "Did You Feel It?" system. The colored circles show the reported intensity at a city and the circle's size is proportional to population.
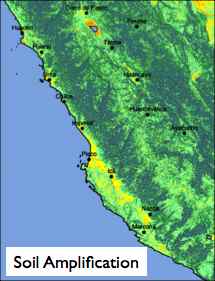
- ShakeMap generates a soil/rock site-specific ground-motion amplification map based on topographic slope. This map accounts for the tendency of soft-soil sites to experience stronger ground motion amplification than rock sites.
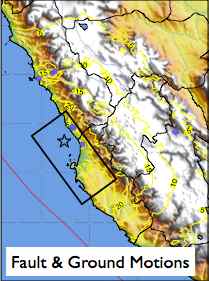
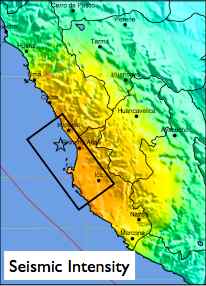
- Information about the fault geometry and size (black rectangle) is added when it becomes available. The ShakeMap system then produces regional ground shaking estimates (yellow contours) using the reported intensities, the site-specific ground-motion amplification map, and seismic wave attenuation equations that account for the variation of seismic shaking intensity with magnitude, fault distance and depth.
- The ShakeMap system then converts the estimated ground motions to a map of seismic intensity.
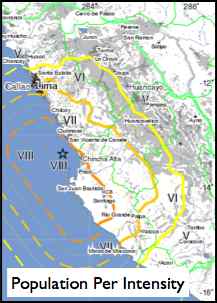
- The population affected at each intensity level is computed and intensities and populations at nearby cities tabulated by combining the map of intensity with the Landscan population database.
- Based on the population exposed to each shaking intensity level, the PAGER system estimates total shaking-related losses based on country-specific models developed from economic and casualty data collected from past earthquakes.
- The alert levels are determined by estimated ranges of fatalities and economic loss, with the higher of the two setting the overall alert level. The alert level determines which users are actively notified, and, at the same time, all PAGER content is automatically distributed to the web on the USGS Earthquake Hazards Program Web pages, as part of the earthquake summary information, for immediate consumption.
The PAGER Earthquake Impact Scale
PAGER uses a new Earthquake Impact Scale (EIS) that is based on two complementary criteria. The first criterion is the estimated cost of damage; this is most suitable for domestic events and those in earthquake-resistant communities. The second criterion, representing estimated ranges of fatalities, is generally more appropriate for global events, particularly in countries with vulnerable buildings and infrastructure.
Simple thresholds, derived from the systematic analysis of past earthquake impact and associated response levels, turn out to be quite effective in communicating predicted impact and response needed after an event characterized by alerts of green (little or no impact), yellow (regional impact and response), orange (national-scale impact and response), and red (international response).
Corresponding fatality thresholds for yellow, orange, and red alert levels are 1, 100, and 1,000, respectively. For damage impact, yellow, orange, and red thresholds are triggered by estimated losses reaching $1 million, $100 million, and $1 billion respectively.
The rationale for this dual approach to earthquake alerting stems from the recognition that relatively high fatalities, injuries, and homelessness dominate in countries where local building practices typically lend themselves to high collapse and casualty rates, and it is these impacts that drive prioritization for international response. In contrast, it is often financial and overall societal impacts that trigger the level of response in regions or countries where prevalent earthquake-resistant construction practices greatly reduce building collapse and resulting fatalities.
Since PAGER calculations are available well in advance of ground-truth observations or news accounts, PAGER information can be a primary alerting tool for domestic as well as international earthquake disasters. An example of the PAGER summary product, or onePAGER, for the February 27, 2010 magnitude 8.8 Chile earthquake that killed 486 people, shows that the earthquake would trigger a red alert level based on projected economic losses, and an orange alert level for estimated fatalities.
Though PAGER uses simple and intuitive color-coded alerting criteria, it preserves the necessary uncertainty measures by which one can gauge the likelihood for the alert to be over- or underestimated. For example, if the likelihood of green and yellow alerts are comparable, there is little in the loss model to distinguish between the two, and users should be aware of this uncertainty in the alert level. In other cases, skewed likelihoods point more to confidence in the alert level.
Using the earthquake impact scale, PAGER's rapid loss estimates can be used to adequately recommend alert levels and suggest appropriate response protocols, despite their uncertainties. Demanding or awaiting observations or loss estimates with a high level of accuracy may delay response and increase the loss.
| Alert Level and Color | Estimated Fatalities | Estimated Losses (USD) |
|---|---|---|
| Red | 1,000+ | $1 billion+ |
| Orange | 100 - 999 | $100 million - $1 billion |
| Yellow | 1 - 99 | $1 million - $100 million |
| Green | 0 | < $1 million |
Ongoing PAGER Developments
The USGS is improving the PAGER system to include more comprehensive loss-estimate methodologies that take into account more detailed building inventories representing sub-country-level regional variations, more complete population demographics (including time of day population shifts), and better tools to compute building damage. Such datasets are very difficult and time consuming to acquire and are not available for many areas of the globe. In particular, more detailed country-level building inventories are key for describing the dominant vulnerable structures that contribute to casualties in the region.
Knowledge of the main collapse "culprits" is vital for response, public safety, recovery, and long-term mitigation. Related USGS developments under the auspices of the PAGER Project include rapid determination of fault geometry, size, and rupture characteristics; refined global estimates of seismic soil-amplification patterns; ShakeMap enhancements; ground-motion and loss-uncertainty analyses; and earthquake-induced landslide and liquefaction probability mapping.
Acknowledgments
PAGER development and maintenance are supported by the USGS under the Advanced National Seismic System (ANSS) with additional funding from the U.S. Agency for International Development/Office of Foreign Disaster Assistance (USAID/OFDA). Landscan population data from Oak Ridge National Laboratory, and data from Munich Reinsurance, EM-DAT, and NOAA were vital for developing and calibrating PAGER loss models.