Following an earthquake, rapid and accurate assessment of the damage or performance of a building is of paramount importance to stakeholders including building owners, leasers, occupants, city officials and rescue teams. These stakeholders require answers to key questions such as:
- Is there visible or hidden damage?
- If damage occurred, what is the extent?
- Does the damage threaten other nearby structures?
- Can the structure be occupied immediately without compromising life safety or is life safety questionable?
As a result, property damage and economical loss due to lack of a permit to enter and/or re-occupy a building may be significant.
Tagging Following an Earthquake
In general, assessments of damage to buildings (tagging) following an earthquake are performed by city-designated engineers following procedures similar to ATC-20 tagging requirements (ATC 1989). Tagging usually involves visual inspection only and is implemented by colored tags indicative of potential hazard to occupants:
- Green indicates the building can be occupied (the building does not pose a threat to life safety)
- Yellow indicates limited occupation (the building is hazardous to life safety but allows limited entrance to retrieve possessions)
- Red indicates entrance is prohibited (the building is hazardous to life)
Alternative Solution: Evolution of Sensor-based Real-time Seismic Health Monitoring
In early 2000, an alternative to tagging allowed building owners and engineers to utilize sensors to monitor the real-time response of a structure instrumented as a health monitoring tool. There are two types, which were examined as “cover stories” in Earthquake Spectra:
-

Differential GPS (Çelebi and Sanli, 2002) with high sampling ratios to obtain displacements. Since GPS units need line of site to GPS satellites, they can only be deployed on the roof of a building, limiting data availability. Also, GPS sampling rates are limited and therefore, applications could be used only for tall buildings.
-

Classical accelerometer-deployed structures (Çelebi and others, 2004) are configured to obtain acceleration data in real-time and compute displacement by double-integration.
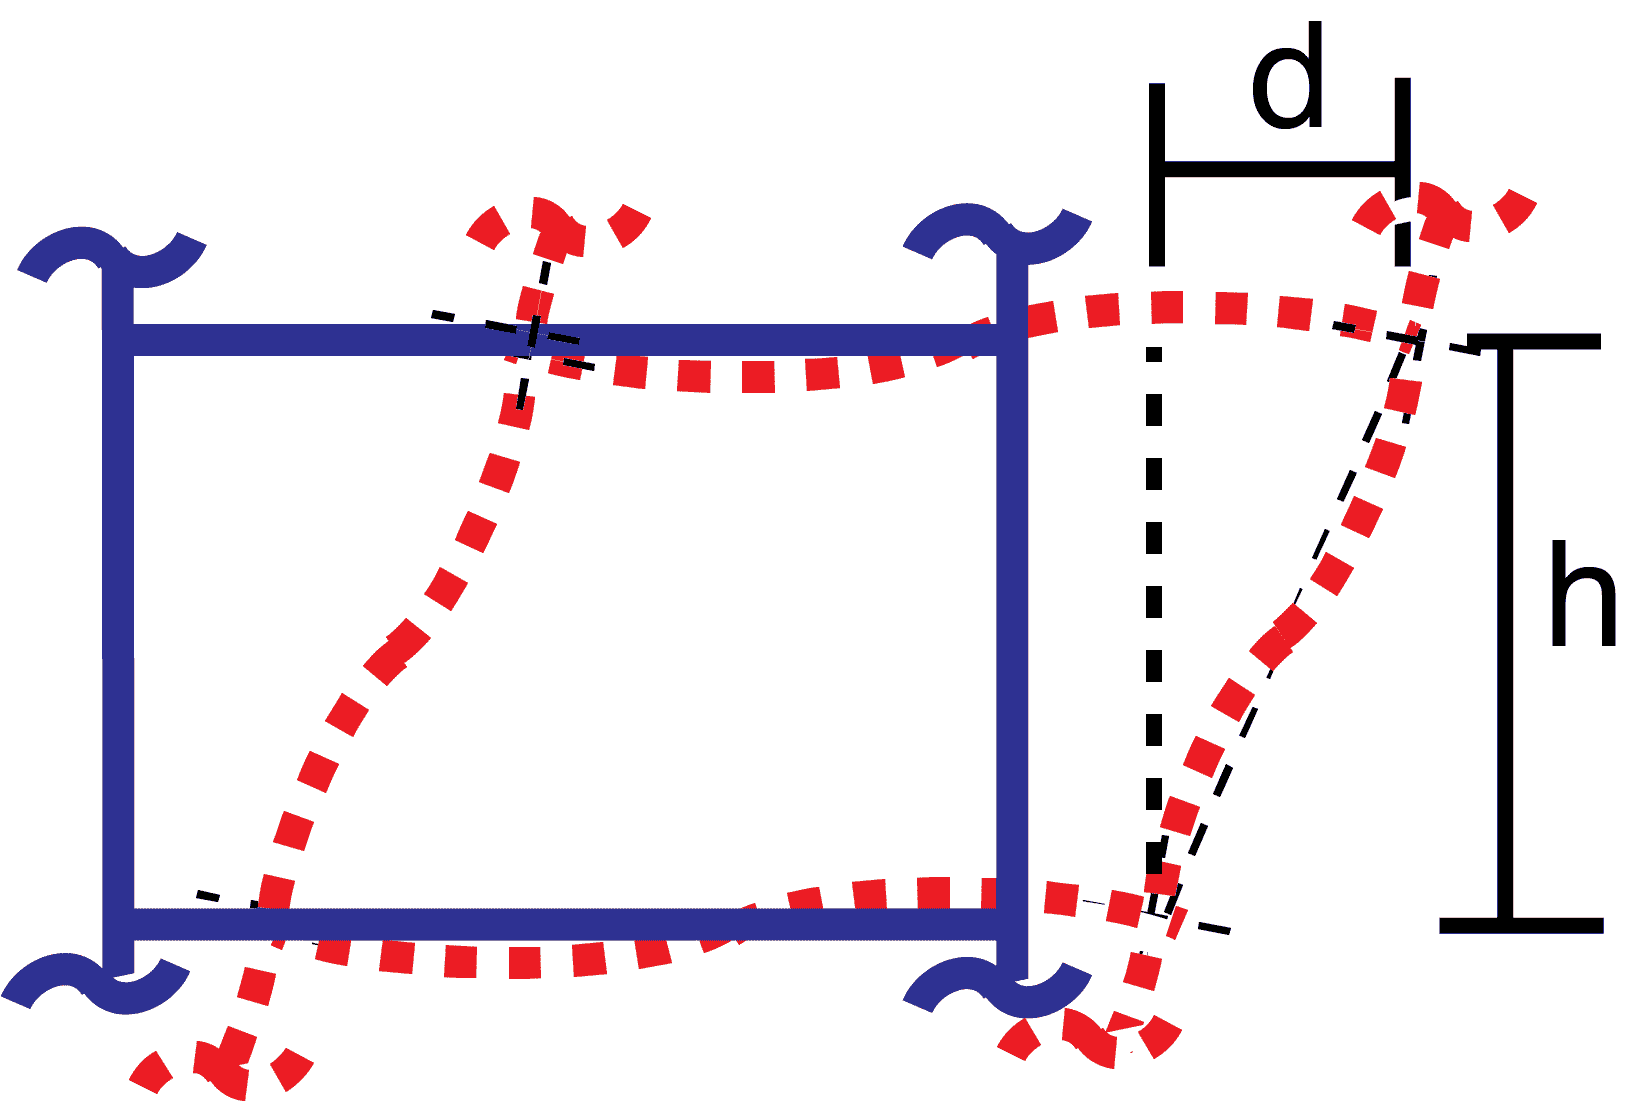
After a building is instrumented, drift ratios1 are computed from relative displacements between consecutive floors and used as the main parametric indicator of damage to a building.

The next step is to relate drift ratios to the performance-based, force-deformation curve hypothetically represented in Figure 1. When drift ratios are determined from measured responses of the building, the performance and “damage state” of the building can be estimated as in Figure 2. Hypothetical levels of deformation (displacements and/or drift ratios) are established and related to the performance curve FEMA-274.
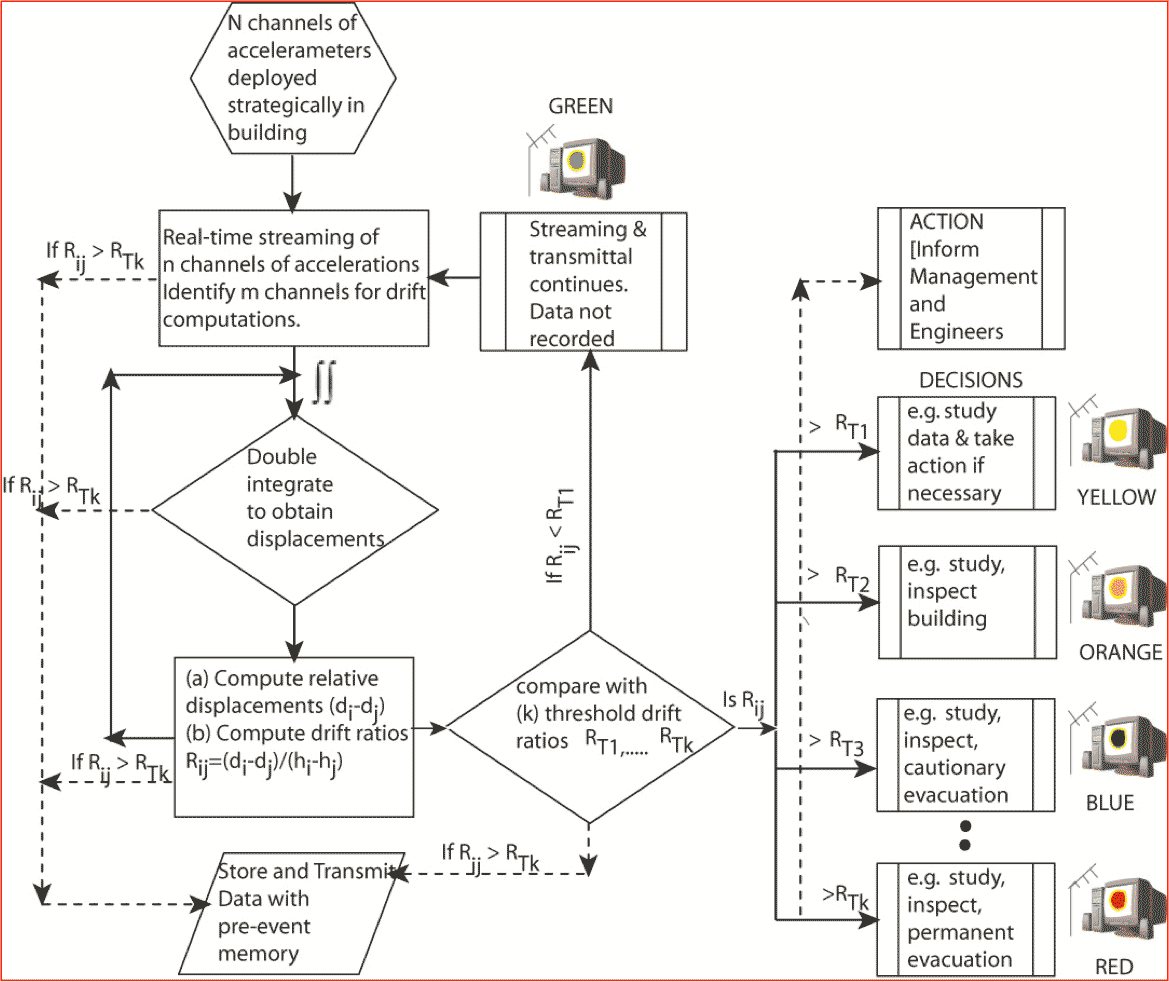
To date, experience with both types of sensor deployments (GPS and accelerometers) indicate that they are reliable enough and provide pragmatic alternatives to alert owners and other authorized parties to make informed decisions and select choices for pre-defined actions following significant events. Thus, in the United States, and, as well as we know, in the world, the sensor-based data processes described in this flowchart and discussed in detail in Çelebi et al. (2002, 2004) and Çelebi (2008) are the first near real-time seismic health monitoring developments. Furthermore, recent adoption of such methods by financial and industrial enterprises is testimony to their viability. Two major companies developed software based on the flowchart in Figure 3 provided by USGS research and development.


Data to Date
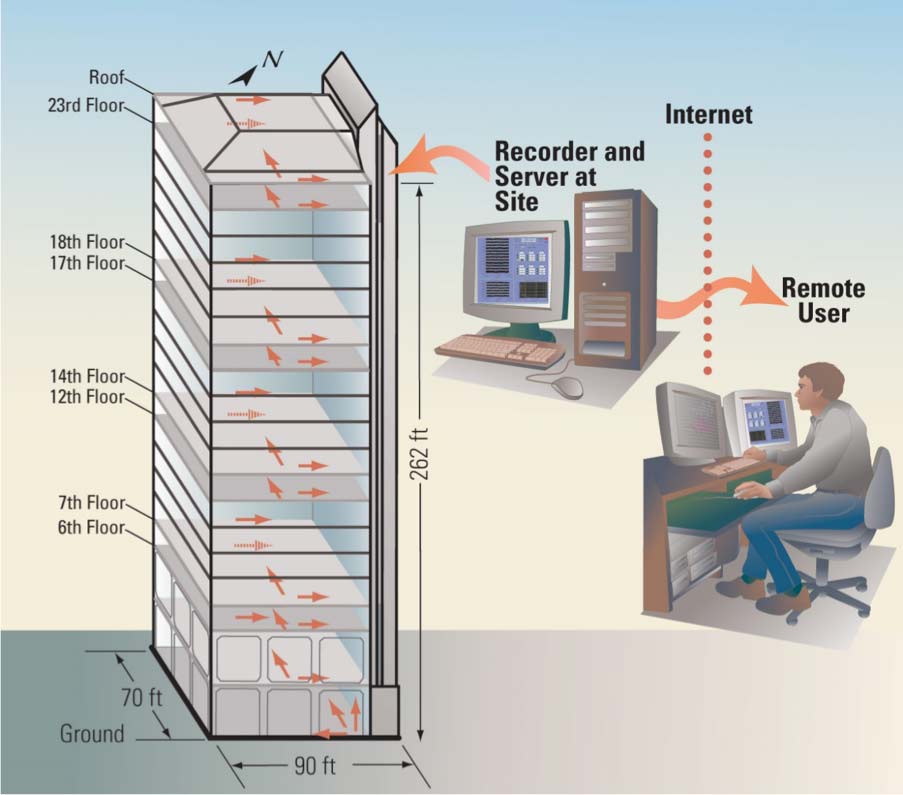
The system recorded responses of a building in San Francisco to multiple earthquakes since 2003. No single event was large or close enough to cause threshold drift ratios to be exceeded and hence trigger the alarm system described in the flowchart or S2HM software (Figures 3 and 5). However, we used the data from a small earthquake to confirm the quality of the data from the system.
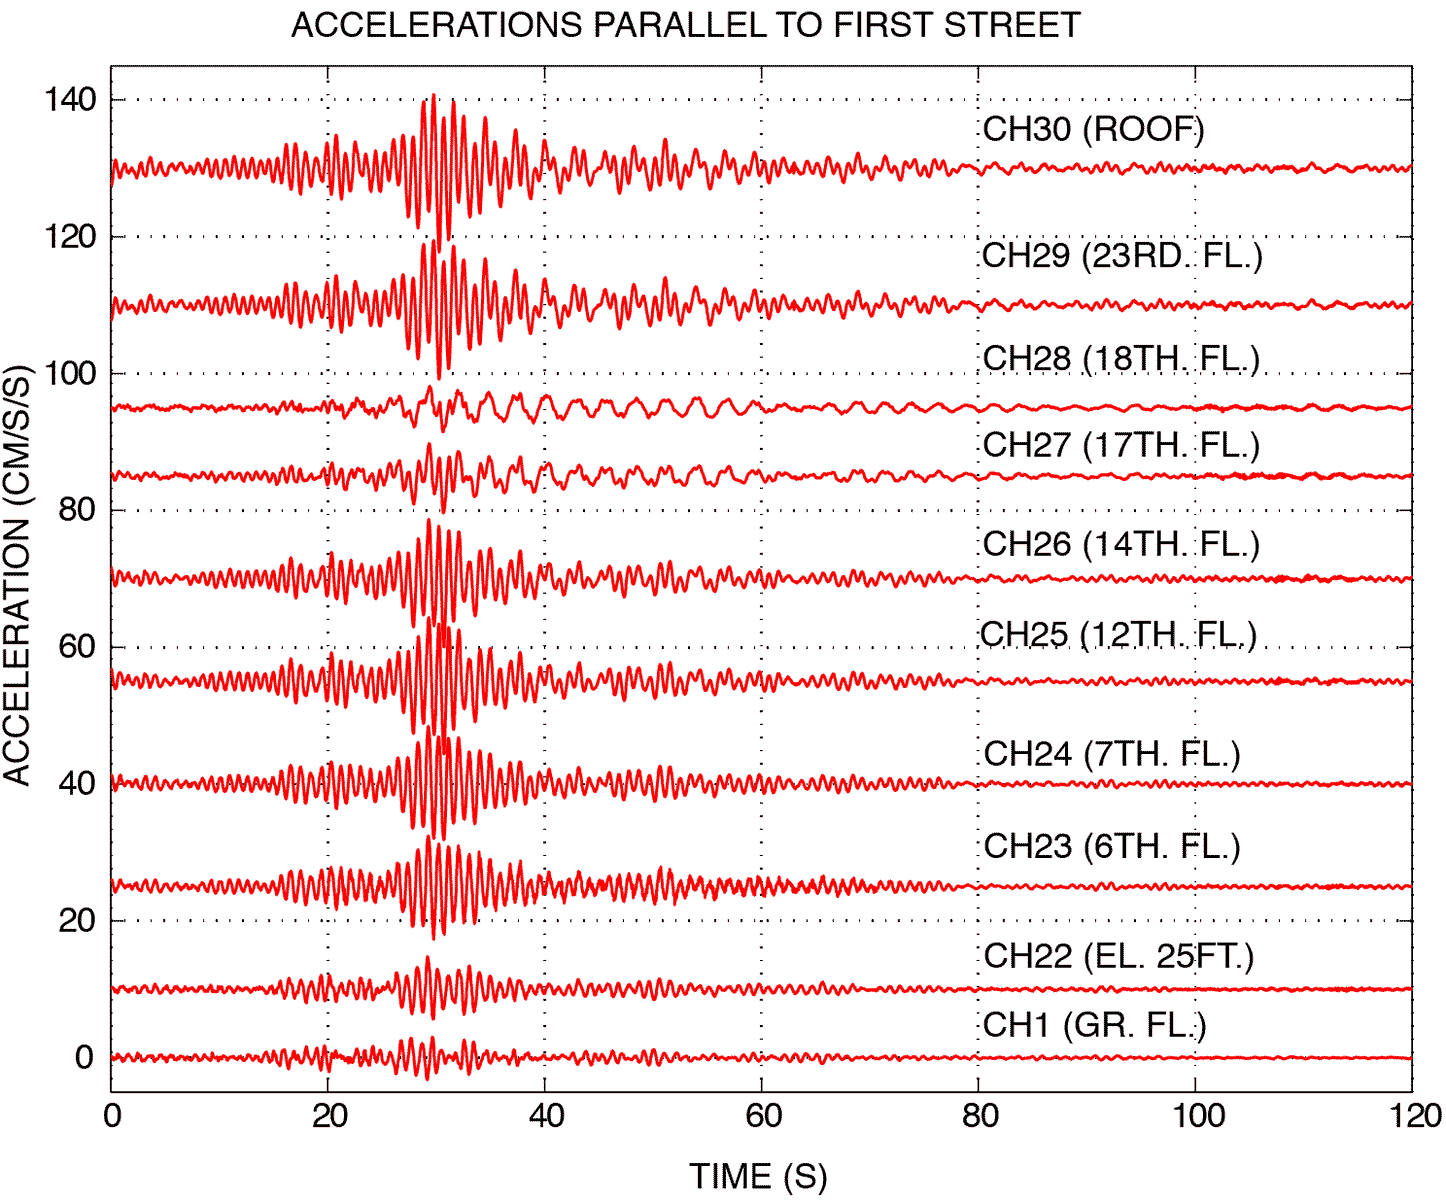
During the December 22, 2003 San Simeon, CA earthquake (Mw=6.4), at an epicentral distance of 258 km, a complete set of low-amplitude earthquake response data was recorded in the building. The largest peak acceleration was approximately 1 % of g. Synchronized bandpass-filtered accelerations and corresponding double-integrated displacements are exhibited in Figure 6 for one side of the building.


Summary
An efficient and technically sound seismic structural health monitoring procedure using drift ratios linked to Performance Based Earthquake Engineering (PBEE) developed in early 2000 is now an established method and adopted by many users and applied in multiple buildings in the US and other countries.