Station P552
- assignmentField Logs(3)
- scatter_plotQuality Control Data
- show_chartKinematic Data
- wb_sunnyWeather
- cloudAQI
- descriptionNGS Datasheets
- Last observation
- Jan 18, 2022
- Closest stations
5 closest stations in all networks
 P578
(1 km)
P578
(1 km)
 P782
(2.7 km)
P782
(2.7 km)
 WATH
(3.5 km)
WATH
(3.5 km)
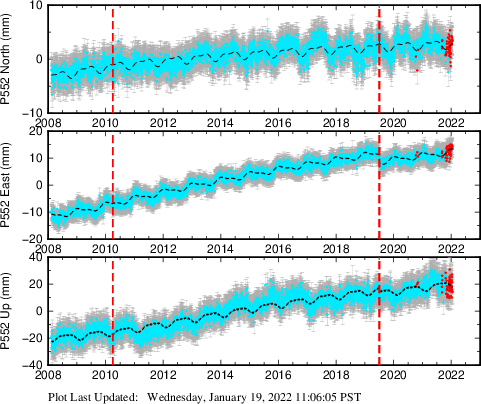
NA-fixed
Plots
Downloads
Velocities
| Velocity (mm/yr) | Velocity standard deviation (mm/yr) | Last observation | Intercept (mm) | Intercept standard deviation (mm) | Reference date | Reference year | Reference day of year | |
|---|---|---|---|---|---|---|---|---|
| North | 24.99 | 0.88 | 2022-01-17 | -209.88 | 169.90 | 2008.123203 | 2008 | 46 |
| East | -22.26 | 0.86 | 2022-01-17 | -200.87 | 165.36 | 2008.123203 | 2008 | 46 |
| Up | -1.07 | 3.72 | 2022-01-17 | -687.83 | 715.63 | 2008.123203 | 2008 | 46 |
Offsets
| Decimal date | N offset (mm) | N uncertainty (mm) | E offset (mm) | E uncertainty (mm) | U offset (mm) | U uncertainty (mm) | Type | Earthquake magnitude | Earthquake information | Distance from epicenter (km) | |
|---|---|---|---|---|---|---|---|---|---|---|---|
| 2010-04-04 | 2010.25462 | 0.02 | 0.45 | 0.13 | 0.45 | -0.75 | 1.58 | earthquake | 7.2 | ci14607652 | 592.5 |
| 2019-07-04 | 2019.50376 | 0.94 | 0.95 | -0.05 | 1.03 | -0.2 | 3.2 | earthquake | 6.4 | ci38443183 | 247.9 |
| 2019-07-06 | 2019.50924 | -0.87 | 0.95 | -3.08 | 1.03 | -2.27 | 3.21 | earthquake | 7.1 | ci38457511 | 239 |
Noise
| White noise (mm) | Amplitude of first power law (mm/yr^(n1/4)) | n1 (spectral index of first power law) | Lower frequency limit for band-pass (BP) filtered noise (cycle/year) | Upper frequency limit for band-pass (BP) filtered noise (cycle/year) | Number of poles for BP filtered noise | Amplitude of BP filtered noise (mm) | n2 (spectral index of second power law) | Amplitude of second power law (mm/yr^(n2/4)) | |
|---|---|---|---|---|---|---|---|---|---|
| North | 0.37 | 2.44 | 1.00 | 0.50000 | 2.00000 | 1 | 0.000 | 2.00 | 0.00 |
| East | 0.48 | 2.31 | 1.00 | 0.50000 | 2.00000 | 1 | 0.000 | 2.00 | 0.01 |
| Up | 1.34 | 7.62 | 1.00 | 0.50000 | 2.00000 | 1 | 0.000 | 2.00 | 0.71 |
Post-seismic
| Decimal date | N log amplitude (mm) | N log amplitude standard deviation (mm) | N time constant (years) | E log amplitude (mm) | E log amplitude standard deviation (mm) | E time constant (years) | U log amplitude (mm) | U log amplitude standard deviation (mm) | U time constant (years) | |
|---|---|---|---|---|---|---|---|---|---|---|
| 2003-12-23 | 2003.97467 | -12.43 | 181.04 | 0.0001 | 313.34 | 176.29 | 0.0001 | 749.59 | 757.65 | 0.0001 |
| 2004-09-29 | 2004.74196 | 19.7 | 147.48 | 0.0001 | -244.66 | 143.63 | 0.0001 | -615.22 | 616.34 | 0.0001 |
Seasonal
| Reference date | Reference year | Reference day of year | Amplitude of cosine (365.25-day period), mm | Standard deviation of cosine amplitude (365.25-day period) | Amplitude of sine (365.25-day period), mm | Standard deviation of sine amplitude (365.25-day period) | Amplitude of cosine (180.625-day period), mm | Standard deviation of cosine amplitude (180.625-day period) | Amplitude of sine (180.625-day period), mm | Standard deviation of sine amplitude (180.625-day period) | Amplitude of cosine (14.76-day period), mm | Standard deviation of cosine amplitude (14.76-day period) | Amplitude of sine (14.76-day period), mm | Standard deviation of sine amplitude (14.76-day period) | Amplitude of cosine (13.63-day period), mm | Standard deviation of cosine amplitude (13.63-day period) | Amplitude of sine (13.63-day period), mm | Standard deviation of sine amplitude (13.63-day period) | |
|---|---|---|---|---|---|---|---|---|---|---|---|---|---|---|---|---|---|---|---|
| North | 2008.123203 | 2008 | 46 | 0.13 | 0.09 | 0.65 | 0.09 | 0.24 | 0.07 | -0.23 | 0.07 | 0.02 | 0.02 | 0.00 | 0.02 | ||||
| East | 2008.123203 | 2008 | 46 | 0.90 | 0.09 | -0.23 | 0.09 | -0.19 | 0.06 | -0.33 | 0.06 | -0.08 | 0.02 | -0.09 | 0.02 | ||||
| Up | 2008.123203 | 2008 | 46 | -2.16 | 0.31 | -0.19 | 0.32 | -0.71 | 0.22 | -0.06 | 0.22 | -0.06 | 0.08 | 0.47 | 0.08 |
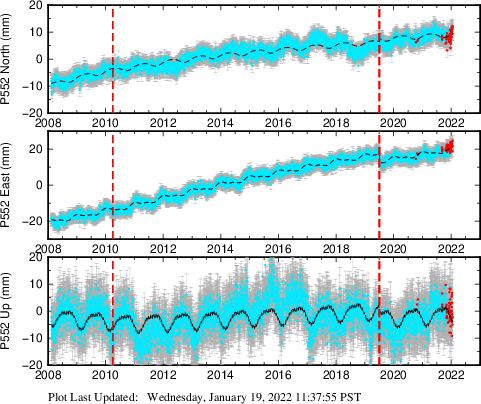
ITRF2008
Plots
Downloads
Velocities
| Velocity (mm/yr) | Velocity standard deviation (mm/yr) | Last observation | Intercept (mm) | Intercept standard deviation (mm) | Reference date | Reference year | Reference day of year | |
|---|---|---|---|---|---|---|---|---|
| North | 12.63 | 1.35 | 2022-01-18 | -203.63 | 260.57 | 2008.123203 | 2008 | 46 |
| East | -35.84 | 1.14 | 2022-01-18 | -380.96 | 219.53 | 2008.123203 | 2008 | 46 |
| Up | 1.73 | 3.36 | 2022-01-18 | -185.80 | 648.06 | 2008.123203 | 2008 | 46 |
Offsets
| Decimal date | N offset (mm) | N uncertainty (mm) | E offset (mm) | E uncertainty (mm) | U offset (mm) | U uncertainty (mm) | Type | Earthquake magnitude | Earthquake information | Distance from epicenter (km) | |
|---|---|---|---|---|---|---|---|---|---|---|---|
| 2010-04-04 | 2010.25462 | -0.17 | 0.63 | -0.71 | 0.61 | -0.72 | 1.67 | earthquake | 7.2 | ci14607652 | 592.5 |
| 2019-07-04 | 2019.50376 | 2.67 | 1.21 | 0.33 | 1.28 | -3.31 | 3.36 | earthquake | 6.4 | ci38443183 | 247.9 |
| 2019-07-06 | 2019.50924 | -1.48 | 1.21 | -4.43 | 1.28 | 0.34 | 3.36 | earthquake | 7.1 | ci38457511 | 239 |
Noise
| White noise (mm) | Amplitude of first power law (mm/yr^(n1/4)) | n1 (spectral index of first power law) | Lower frequency limit for band-pass (BP) filtered noise (cycle/year) | Upper frequency limit for band-pass (BP) filtered noise (cycle/year) | Number of poles for BP filtered noise | Amplitude of BP filtered noise (mm) | n2 (spectral index of second power law) | Amplitude of second power law (mm/yr^(n2/4)) | |
|---|---|---|---|---|---|---|---|---|---|
| North | 0.40 | 3.34 | 1.00 | 0.50000 | 2.00000 | 1 | 0.000 | 2.00 | 0.13 |
| East | 0.54 | 3.12 | 1.00 | 0.50000 | 2.00000 | 2 | 0.177 | 2.00 | 0.00 |
| Up | 1.18 | 9.12 | 1.00 | 0.50000 | 2.00000 | 1 | 0.000 | 2.00 | 0.08 |
Post-seismic
| Decimal date | N log amplitude (mm) | N log amplitude standard deviation (mm) | N time constant (years) | E log amplitude (mm) | E log amplitude standard deviation (mm) | E time constant (years) | U log amplitude (mm) | U log amplitude standard deviation (mm) | U time constant (years) | |
|---|---|---|---|---|---|---|---|---|---|---|
| 2003-12-23 | 2003.97467 | -16.06 | 276.87 | 0.0001 | 597.46 | 233.99 | 0.0001 | 276.55 | 690.06 | 0.0001 |
| 2004-09-29 | 2004.74196 | 39.38 | 225.4 | 0.0001 | -476.04 | 190.64 | 0.0001 | -243.43 | 562.04 | 0.0001 |
Seasonal
| Reference date | Reference year | Reference day of year | Amplitude of cosine (365.25-day period), mm | Standard deviation of cosine amplitude (365.25-day period) | Amplitude of sine (365.25-day period), mm | Standard deviation of sine amplitude (365.25-day period) | Amplitude of cosine (180.625-day period), mm | Standard deviation of cosine amplitude (180.625-day period) | Amplitude of sine (180.625-day period), mm | Standard deviation of sine amplitude (180.625-day period) | Amplitude of cosine (14.76-day period), mm | Standard deviation of cosine amplitude (14.76-day period) | Amplitude of sine (14.76-day period), mm | Standard deviation of sine amplitude (14.76-day period) | Amplitude of cosine (13.63-day period), mm | Standard deviation of cosine amplitude (13.63-day period) | Amplitude of sine (13.63-day period), mm | Standard deviation of sine amplitude (13.63-day period) | |
|---|---|---|---|---|---|---|---|---|---|---|---|---|---|---|---|---|---|---|---|
| North | 2008.123203 | 2008 | 46 | 0.50 | 0.13 | 0.63 | 0.13 | 0.02 | 0.09 | -0.13 | 0.09 | 0.04 | 0.03 | 0.02 | 0.03 | ||||
| East | 2008.123203 | 2008 | 46 | 0.94 | 0.15 | -0.33 | 0.16 | -0.17 | 0.12 | -0.46 | 0.12 | -0.09 | 0.03 | -0.09 | 0.03 | ||||
| Up | 2008.123203 | 2008 | 46 | -2.79 | 0.34 | -0.70 | 0.34 | -0.85 | 0.24 | -0.17 | 0.24 | -0.06 | 0.08 | 0.53 | 0.08 |
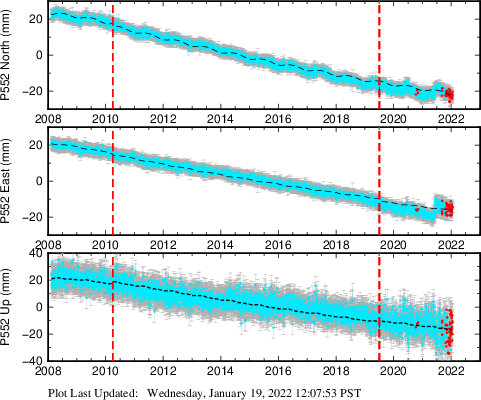
Filtered
Plots
Downloads
Velocities
| Velocity (mm/yr) | Velocity standard deviation (mm/yr) | Last observation | Intercept (mm) | Intercept standard deviation (mm) | Reference date | Reference year | Reference day of year | |
|---|---|---|---|---|---|---|---|---|
| North | 28.93 | 1.02 | 2022-01-18 | 448.33 | 191.78 | 2008.123203 | 2008 | 46 |
| East | -17.17 | 0.56 | 2022-01-18 | 597.78 | 107.53 | 2008.123203 | 2008 | 46 |
| Up | 4.64 | 2.11 | 2022-01-18 | 622.93 | 401.03 | 2008.123203 | 2008 | 46 |
Offsets
| Decimal date | N offset (mm) | N uncertainty (mm) | E offset (mm) | E uncertainty (mm) | U offset (mm) | U uncertainty (mm) | Type | Earthquake magnitude | Earthquake information | Distance from epicenter (km) | |
|---|---|---|---|---|---|---|---|---|---|---|---|
| 2010-04-04 | 2010.25462 | -1.5 | 0.24 | -0.57 | 0.2 | 1.47 | 0.69 | earthquake | 7.2 | ci14607652 | 592.5 |
| 2019-07-04 | 2019.50376 | -4.97 | 0.6 | -0.46 | 0.62 | -9.1 | 2.42 | earthquake | 6.4 | ci38443183 | 247.9 |
| 2019-07-06 | 2019.50924 | 5.15 | 0.61 | -1 | 0.62 | 10.2 | 2.42 | earthquake | 7.1 | ci38457511 | 239 |
Noise
| White noise (mm) | Amplitude of first power law (mm/yr^(n1/4)) | n1 (spectral index of first power law) | Lower frequency limit for band-pass (BP) filtered noise (cycle/year) | Upper frequency limit for band-pass (BP) filtered noise (cycle/year) | Number of poles for BP filtered noise | Amplitude of BP filtered noise (mm) | n2 (spectral index of second power law) | Amplitude of second power law (mm/yr^(n2/4)) | |
|---|---|---|---|---|---|---|---|---|---|
| North | 0.49 | 0.36 | 1.00 | 0.50000 | 2.00000 | 1 | 0.000 | 2.00 | 0.53 |
| East | 0.50 | 0.45 | 1.00 | 0.50000 | 2.00000 | 1 | 0.000 | 2.00 | 0.24 |
| Up | 2.11 | 1.09 | 1.00 | 0.50000 | 2.00000 | 1 | 0.000 | 2.00 | 1.00 |
Post-seismic
| Decimal date | N log amplitude (mm) | N log amplitude standard deviation (mm) | N time constant (years) | E log amplitude (mm) | E log amplitude standard deviation (mm) | E time constant (years) | U log amplitude (mm) | U log amplitude standard deviation (mm) | U time constant (years) | |
|---|---|---|---|---|---|---|---|---|---|---|
| 2003-12-23 | 2003.97467 | -653.98 | 197.64 | 0.0001 | -444.09 | 112.14 | 0.0001 | -710.66 | 416.25 | 0.0001 |
| 2004-09-29 | 2004.74196 | 528.56 | 159.77 | 0.0001 | 350.8 | 90.92 | 0.0001 | 583.79 | 337.08 | 0.0001 |
Seasonal
| Reference date | Reference year | Reference day of year | Amplitude of cosine (365.25-day period), mm | Standard deviation of cosine amplitude (365.25-day period) | Amplitude of sine (365.25-day period), mm | Standard deviation of sine amplitude (365.25-day period) | Amplitude of cosine (180.625-day period), mm | Standard deviation of cosine amplitude (180.625-day period) | Amplitude of sine (180.625-day period), mm | Standard deviation of sine amplitude (180.625-day period) | Amplitude of cosine (14.76-day period), mm | Standard deviation of cosine amplitude (14.76-day period) | Amplitude of sine (14.76-day period), mm | Standard deviation of sine amplitude (14.76-day period) | Amplitude of cosine (13.63-day period), mm | Standard deviation of cosine amplitude (13.63-day period) | Amplitude of sine (13.63-day period), mm | Standard deviation of sine amplitude (13.63-day period) | |
|---|---|---|---|---|---|---|---|---|---|---|---|---|---|---|---|---|---|---|---|
| North | 2008.123203 | 2008 | 46 | -0.52 | 0.05 | 0.52 | 0.05 | 0.00 | 0.03 | 0.06 | 0.03 | 0.00 | 0.01 | 0.01 | 0.01 | ||||
| East | 2008.123203 | 2008 | 46 | -0.13 | 0.03 | -0.21 | 0.03 | 0.00 | 0.02 | -0.08 | 0.02 | -0.01 | 0.01 | -0.01 | 0.01 | ||||
| Up | 2008.123203 | 2008 | 46 | 0.00 | 0.11 | 0.29 | 0.11 | -0.21 | 0.08 | 0.07 | 0.08 | 0.21 | 0.05 | -0.18 | 0.05 |
These results are preliminary. The station positions are unchecked and should not be used for any engineering applications. There may be errors in the antenna heights. The velocities are very dependent on the length of the span of observations. The presence of outliers (errant observations) sometimes contaminates the velocities.