-
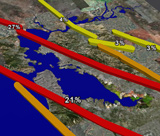
How Likely is a Damaging Earthquake in the Bay Area?
In 2007, earthquake scientists led by the USGS, CGS, and SCEC estimated that there is a 63% probability of a magnitude 6.7 or greater earthquake in the Bay Area in the next 30 years. Although the hazard is spread throughout the Bay Area, some faults are more likely to rupture than others. The two faults in the San Francisco Bay Area most likely to have a damaging earthquake are the Hayward-Rodgers Creek fault system (31%) and the San Andreas Fault (21%). The East Bay has a higher earthquake hazard than the San Francisco peninsula due to the Hayward-Rogers Creek Fault and the higher number of faults that traverse the East Bay. Which fault is closest to your house? What probability for a magnitude 6.7 or greater earthquake in the next 30 years have scientists assigned to it? For a detailed explanation visit the 2007 Earthquake Probability study
Earthquake Probabilities (121 kB)
-
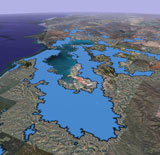
At Risk Populations: Modern Urban Areas
How much has our population grown since 1868? Back in 1868, only 260,000 people lived in the Bay Area. Today, the population has increased by over 25 times to 7.2 million people, all at risk from expected earthquakes on one or more of the Bay Area faults. Over 2 million people live on or close to the Hayward Fault, which has among the highest probability of producing a magnitude 6.7 or greater earthquake in the next 30 years. This Google Earth file shows the present population densities (blue areas) and their proximity to active faults.
Urban Areas (164 kB)
-
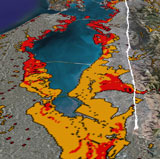
How Likely is Liquefaction to Happen near Me?
This Google Earth file shows a map of the distribution of deposits in the Bay Area most likely to liquefy during the next big earthquake. Liquefaction occurs when young, sandy, water-saturated deposits are shaken strongly during earthquakes. When this occurs, these deposits lose their strength and behave like a liquid, quicksand. Buildings and other structures can be damaged when their foundations sink into these soupy sands. Geologists determine the potential for liquefaction by mapping young, sandy deposits that are likely to contain water.
Liquefaction(404 kB)
This Liquefaction Susceptibility layer is intended solely as an educational tool. The California Geological Survey produces state-mandated regulatory maps that show Zones of Required Investigation for liquefaction (and landslide) hazard. These state maps depict zones where site specific studies are required for new construction. These zone maps also are used in real estate transactions—sellers of properties within a "Zone of Required Investigation" must disclose that fact to prospective buyers. -
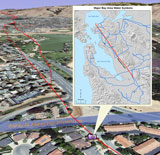
Are Our Infrastructure and Lifelines near the Hayward Fault at Risk?
This Google Earth file shows a few locations, photographs, and maps of important infrastructure near or crossing the Hayward. The Hayward Fault runs through, or near to, some of the most densely urbanized areas in North America. A large portion of California’s economy is dependent on these urban areas that contain a maze of transportation, energy, water, telecommunications, waste disposal, and emergency infrastructure that supports millions of people. The high density of structures and lifelines along the Hayward Fault make this a very dangerous fault. Many if not most of the fault crossing of these important infrastructure have been or are planned to be strengthened to increase their resilience to future earthquakes.
Lifelines (39 kB)
What Can I Do?
To find out what you and your family should do to prepare, and to learn more about earthquake hazards in the San Francisco Bay Area, please see these Preparedness Handbooks.