Rarotonga, Cook Islands
IU RAR commences operations on: 1992,067
| Host | Institute of Geological and Nuclear Sciences |
|---|---|
| Network | IU |
| Latitude | -21.212 |
| Longitude | -159.773 |
| Elevation | 28 |
| Datalogger | Q330-HR |
| Broadband | Streckeisen STS-6A VBB Seismometer |
| Accelerometer | Kinemetrics FBA ES-T EpiSensor Accelerometer |
| Telemetry Status at the NEIC | Pending |
Site


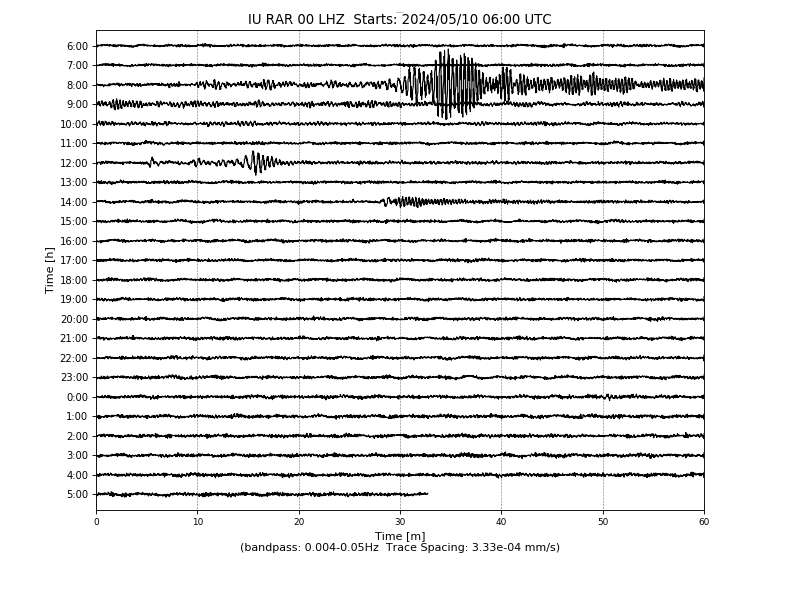
Heliplot