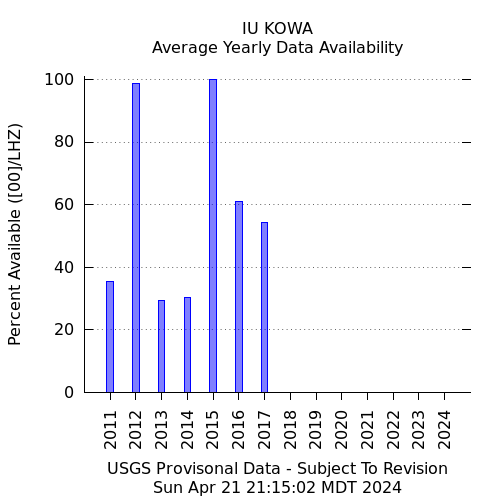
Seismic Network Operations
IU KOWA
Kowa, Mali
IU KOWA commences operations on: 1998,067
| Host: | National Center for Science and Technology Research |
|---|---|
| Latitude: | 14.497 |
| Longitude: | -4.014 |
| Elevation: | 321 |
| Datalogger: | Q330 |
| Broadband: | STS-2_High-gain |
| Accelerometer: | FBA_ES-T_EpiSensor_Accelerometer |
| Telemetry Status at the NEIC: |
|
Site Description: Located in the Niger River delta region of the Sahara desert in Mali continent of Africa. KOWA operates as a remote IRIS2 station with the data processor operating at the airport in Sevare and the acquisition unit operating at the Dogon village of Kowa approximately 10k from Sevare. The site uses radio modems for data transmission and solar power. A dialup modem is operational. Internet access is not available at this time. National language is French with 75% of the poulation speaking Bambara.
Vault Condition: 40 meter horizontal tunnel with approx. 10-15 meters of overburden. (solid rock), *Dry and very hot
Site Geology: Sandstone
| Location Code | Channel Code | Instrument | Flags | Sample Rate | Dip | Azimuth | Depth |
|---|---|---|---|---|---|---|---|
| 20 | HNZ | FBA ES-T EpiSensor Accelerometer | TG | 100.00 | -90.00 | 0.00 | 5.00 |
| 20 | HN2 | FBA ES-T EpiSensor Accelerometer | TG | 100.00 | 0.00 | 90.00 | 5.00 |
| 20 | HN1 | FBA ES-T EpiSensor Accelerometer | TG | 100.00 | 0.00 | 0.00 | 5.00 |
| 10 | HH1 | Trillium 240 broad band | TG | 100.00 | 0.00 | 0.00 | 5.00 |
| 10 | HHZ | Trillium 240 broad band | TG | 100.00 | -90.00 | 0.00 | 5.00 |
| 10 | HH2 | Trillium 240 broad band | TG | 100.00 | 0.00 | 90.00 | 5.00 |
| 00 | HHZ | STS-2 High-gain | TG | 100.00 | -90.00 | 0.00 | 5.00 |
| 00 | HH2 | STS-2 High-gain | TG | 100.00 | 0.00 | 90.00 | 5.00 |
| 00 | HH1 | STS-2 High-gain | TG | 100.00 | 0.00 | 0.00 | 5.00 |
| 30 | LDO | CI/PAS pressure sensor | CW | 1.00 | 0.00 | 0.00 | 5.00 |
| 20 | LNZ | FBA ES-T EpiSensor Accelerometer | CG | 1.00 | -90.00 | 0.00 | 5.00 |
| 20 | LN2 | FBA ES-T EpiSensor Accelerometer | CG | 1.00 | 0.00 | 90.00 | 5.00 |
| 20 | LN1 | FBA ES-T EpiSensor Accelerometer | CG | 1.00 | 0.00 | 0.00 | 5.00 |
| 10 | VHZ | Trillium 240 broad band | CG | 0.10 | -90.00 | 0.00 | 5.00 |
| 10 | VH2 | Trillium 240 broad band | CG | 0.10 | 0.00 | 90.00 | 5.00 |
| 10 | VH1 | Trillium 240 broad band | CG | 0.10 | 0.00 | 0.00 | 5.00 |
| 10 | BHZ | Trillium 240 broad band | CG | 40.00 | -90.00 | 0.00 | 5.00 |
| 10 | LHZ | Trillium 240 broad band | CG | 1.00 | -90.00 | 0.00 | 5.00 |
| 10 | LH2 | Trillium 240 broad band | CG | 1.00 | 0.00 | 90.00 | 5.00 |
| 10 | LH1 | Trillium 240 broad band | CG | 1.00 | 0.00 | 0.00 | 5.00 |
| 10 | BH2 | Trillium 240 broad band | CG | 40.00 | 0.00 | 90.00 | 5.00 |
| 10 | BH1 | Trillium 240 broad band | CG | 40.00 | 0.00 | 0.00 | 5.00 |
| 00 | VHZ | STS-2 High-gain | CG | 0.10 | -90.00 | 0.00 | 5.00 |
| 00 | VH2 | STS-2 High-gain | CG | 0.10 | 0.00 | 90.00 | 5.00 |
| 00 | VH1 | STS-2 High-gain | CG | 0.10 | 0.00 | 0.00 | 5.00 |
| 00 | LHZ | STS-2 High-gain | CG | 1.00 | -90.00 | 0.00 | 5.00 |
| 00 | LH2 | STS-2 High-gain | CG | 1.00 | 0.00 | 90.00 | 5.00 |
| 00 | LH1 | STS-2 High-gain | CG | 1.00 | 0.00 | 0.00 | 5.00 |
| 00 | BHZ | STS-2 High-gain | CG | 40.00 | -90.00 | 0.00 | 5.00 |
| 00 | BH2 | STS-2 High-gain | CG | 40.00 | 0.00 | 90.00 | 5.00 |
| 00 | BH1 | STS-2 High-gain | CG | 40.00 | 0.00 | 0.00 | 5.00 |

PDF, Last Month

PDF, Last Year

PDF, Month

PDF, Current Week

PDF, Year


Availability, Since 1972

Availability, 2 Month

As part of the annual calibration process, the USGS runs a sequence that includes a random, a step, and several sine wave calibrations. The USGS analyzes the random binary calibration signal in order to estimate the instrument response. The figures below show the results from the analysis of the most recent processed calibration at the station.
We use an iterative three-step method to estimate instrument response parameters (poles, zeros, sensitivity and gain) and their associated errors using random calibration signals. First, we solve a coarse non-linear inverse problem using a least squares grid search to yield a first approximation to the solution. This approach reduces the likelihood of poorly estimated parameters (a local-minimum solution) caused by noise in the calibration records and enhances algorithm convergence. Second, we iteratively solve a non-linear parameter estimation problem to obtain the least squares best-fit Laplace pole/zero/gain model. Third, by applying the central limit theorem we estimate the errors in this pole/zero model by solving the inverse problem at each frequency in a 2/3rds-octave band centered at each best-fit pole/zero frequency. This procedure yields error estimates of the 99% confidence interval.
| Loc | Chan | Cal Date | Epoch-Span | Grade | Amp Nominal Error (dB) | Amp Best Fit Error (dB) | Phase Nominal Error (degree) | Phase Best Fit Error (degree) | Sensor | Cal Type |
|---|---|---|---|---|---|---|---|---|---|---|
| 00 | BHZ | 2011:148 | 2011:147 to No Ending T | A | 0.013827 | 0.012269 | 0.07048 | 0.076279 | STS-2-HG | Random |
| 10 | BHZ | 2011:149 | 2011:147 to No Ending T | A | 0.01436 | 0.0076999 | 0.10432 | 0.088975 | TR240 | Random |
-
Current IssuesSince Aug. 12 (2012) timing quality has been bad. GPS antenna replacement is planned.
-
2011-11-05Power system repaired and data flow has resumed.
-
2011-06-11Data flow stopped due to power system failure.
-
2011-05-25Upgraded to Q330 digitizer.

