Johnston Island, USA
IU JOHN commences operations on: 1998,205
| Host | US Fish and Wildlife Service |
|---|---|
| Network | IU |
| Latitude | 16.733 |
| Longitude | -169.529 |
| Elevation | 2 |
| Datalogger | Q330-HR |
| Broadband | Streckeisen STS-2 Standard-gain |
| Accelerometer | Kinemetrics FBA ES-T EpiSensor Accelerometer |
| Telemetry Status at the NEIC | Pending |
Heliplot

Latency
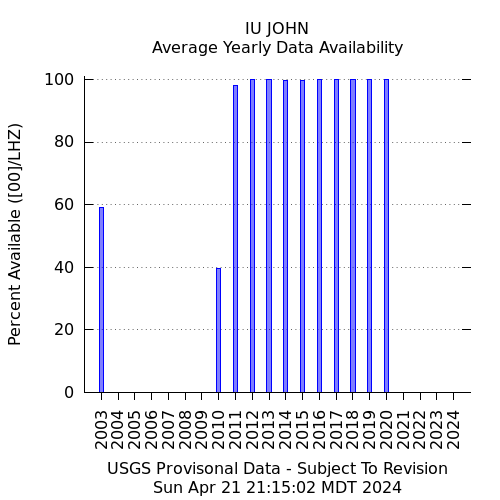
Availability
Past 30 Days

Past 365 Days

Yearly