Disney Wilderness Preserve, Florida, USA
IU DWPF commences operations on: 1998,214
| Host | The Nature Conservancy |
|---|---|
| Network | IU |
| Latitude | 28.11 |
| Longitude | -81.433 |
| Elevation | 30 |
| Datalogger | Q330-HR |
| Broadband | Streckeisen STS-6A VBB Seismometer |
| Accelerometer | Kinemetrics FBA ES-T EpiSensor Accelerometer |
| Telemetry Status at the NEIC | Pending |
Site


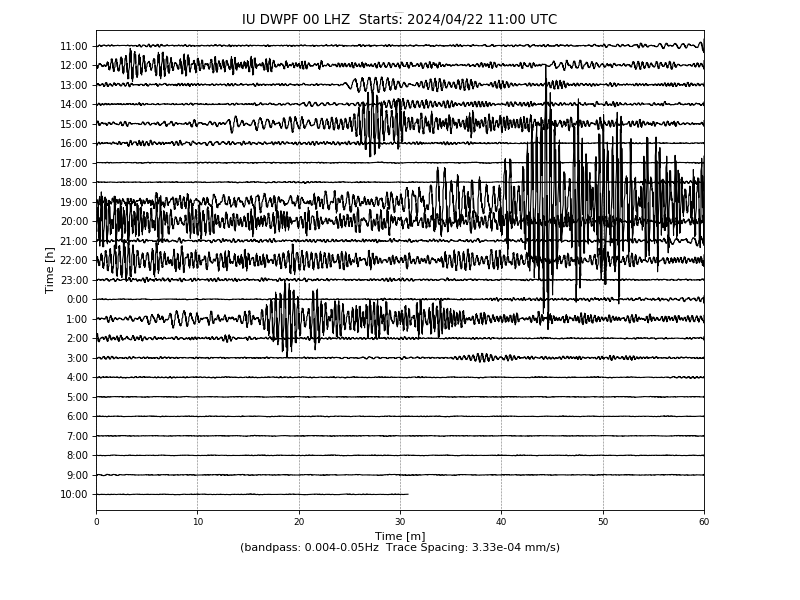
Heliplot
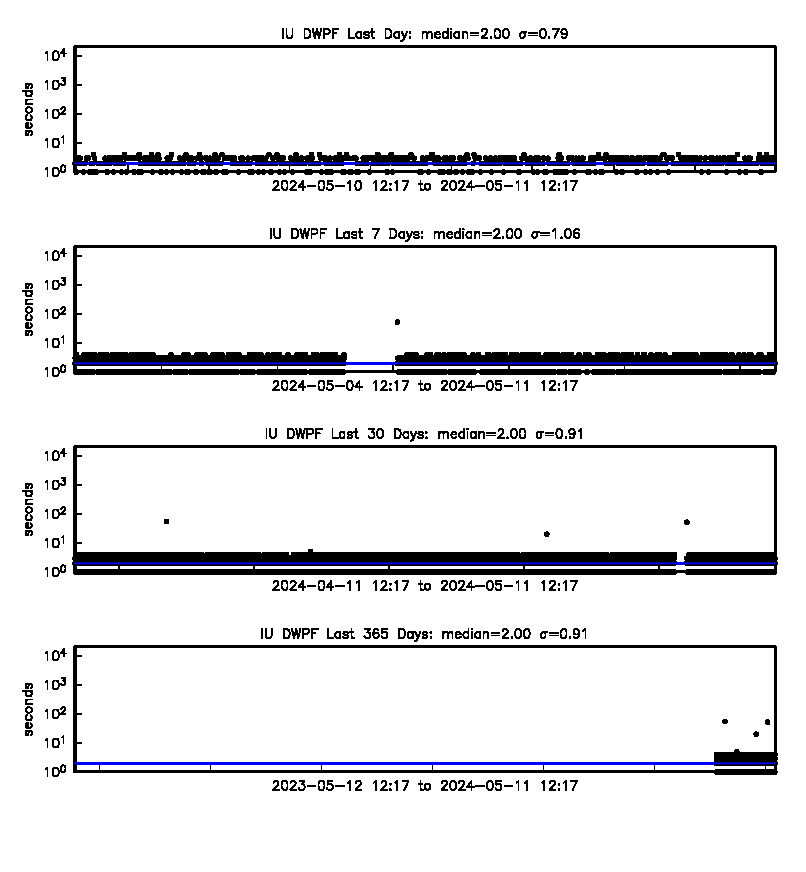
Latency
Availability
Past 30 Days

Past 365 Days

Yearly
