Corvallis, Oregon, USA
IU COR commences operations on: 1989,299
| Host | Oregon State University |
|---|---|
| Network | IU |
| Latitude | 44.586 |
| Longitude | -123.305 |
| Elevation | 110 |
| Datalogger | Q330-HR |
| Broadband | Streckeisen STS-6A VBB Seismometer |
| Accelerometer | Kinemetrics FBA ES-T EpiSensor Accelerometer |
| Telemetry Status at the NEIC | Pending |
Site


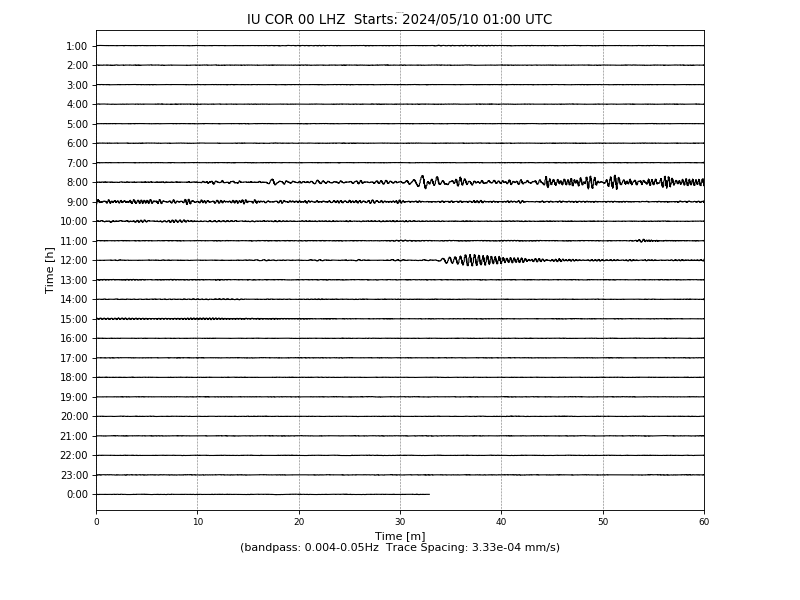
Heliplot
Latency
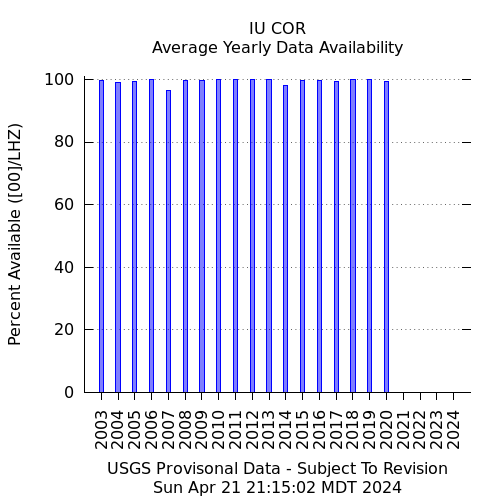
Availability
Past 30 Days

Past 365 Days

Yearly