Presa de Sabenta, Dominican Republic
CU SDDR commences operations on: 2006,242
| Host | Dept. of Environment and Natural Resources |
|---|---|
| Network | CU |
| Latitude | 18.982 |
| Longitude | -71.288 |
| Elevation | 589 |
| Datalogger | Q330 |
| Broadband | Streckeisen STS-2 Standard-gain |
| Accelerometer | Kinemetrics FBA ES-T EpiSensor Accelerometer |
| Telemetry Status at the NEIC | Pending |
Site


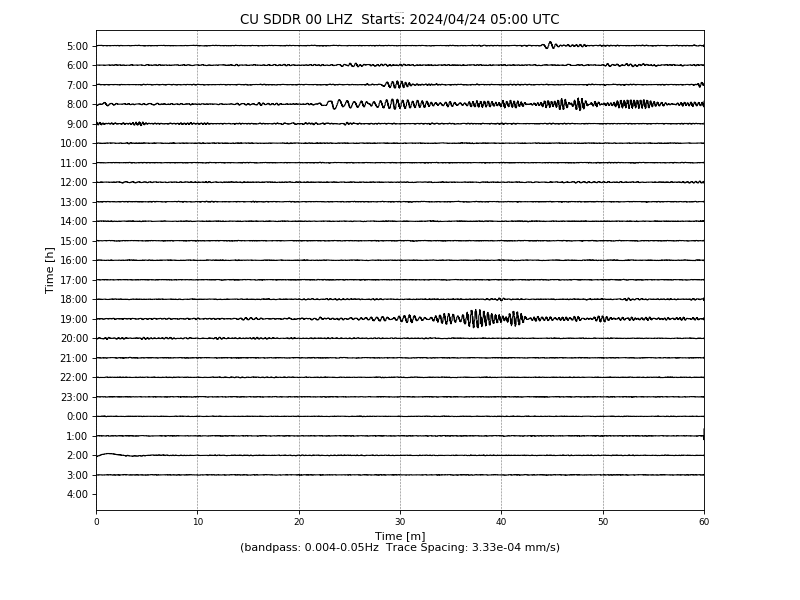
Heliplot