This scenario shows the ground shaking from a magnitude 7.2 earthquake involving rupture of both the Hayward and Rodgers Creek faults. In this scenario, rupture begins beneath San Pablo Bay and simultaneously proceeds towards the south on the Hayward fault and towards north on the Rodgers Creek fault. Although earthquakes on multiple faults do occur, they are much rarer than earthquakes on a single fault. Consequently, this scenario, which involves rupture of two faults, is much less likely to occur than any of the magnitude 6.8 or magnitude 7.0 scenarios.
This scenario earthquake ruptures 51 miles (83 km) of the Hayward fault from San Pablo Bay to Fremont and 39 miles (63 km) of the Rodgers Creek fault from San Pablo Bay to north of Santa Rosa. The average slip or offset across the Hayward fault is about 4 ft (1.2 m). For the Rodgers Creek fault it is about 3 ft (0.9 m).
San Pablo Bay Epicenter
Map View

Detailed Perspective Views
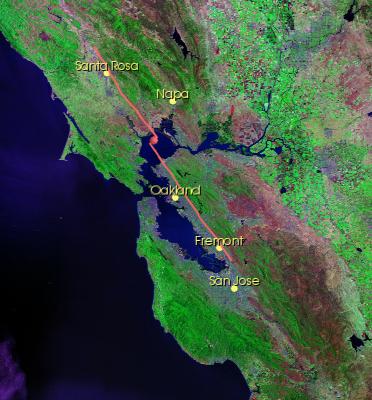
The detailed, perspective views show the ground shaking from a viewpoint two miles (three kilometers) above the earth looking towards each location. In each movie the left panel shows a map view of the area with the fault highlighted in red, the epicenter (location where the rupture starts) identified by the red ball, and the location shown in the right panel labeled in yellow. In the right panel the deformation of the ground associated with the propagation of the seismic waves is exaggerated by a factor of 1000. The topography has been exaggerated by a factor of four to make the hills and mountains more readily visible.
Click on the map to view the normal resolution movie for that location. HD versions are available below.
At locations very close to the faults such as Fremont, Oakland, and Santa Rosa, the ground moves up to 2-3 ft. In San Jose the peak displacement is about 1 ft.


The colors indicate the peak intensity of the shaking up to the current time in the movie at each location. See Explanation of Colors for a more detailed description of the color scheme.
The movies are available in two different resolutions. The normal resolution versions are typically 10 MB in size. The high definition (HD) versions are typically 30 MB in size and are best viewed on high resolution displays.
These images and movies are in the public domain and may be used freely. Please credit the U.S Geological Survey.
« Back