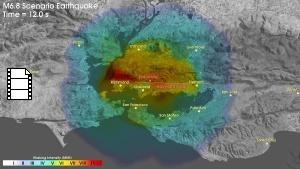
These three scenarios show the ground shaking for a magnitude 6.8 earthquake on the Hayward fault. The slip or offset across the fault is the same in all three cases, but the earthquake ruptures start in different locations- Oakland, Hayward, or Fremont. Because relatively little is known about the 1868 earthquake rupture, we have not attempted to simulate the 1868 earthquake in detail; however, the magnitude 6.8 scenario with the Hayward epicenter is similar to the 1868 earthquake in rupture length, magnitude, and starting location.
These scenario earthquakes rupture 33 miles (54 km) of the Hayward fault extending from Fremont to Berkeley. The average slip or offset across the fault is about 2 ft (0.7 m).
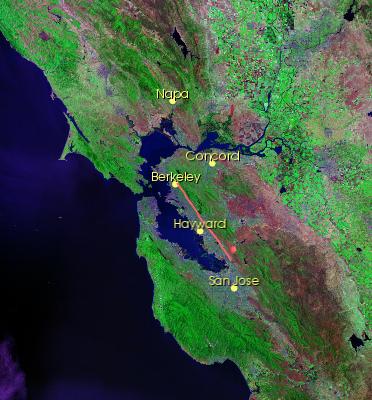
Oakland Epicenter
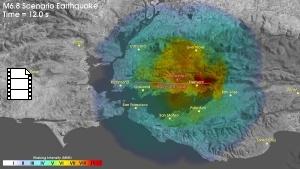
Map View
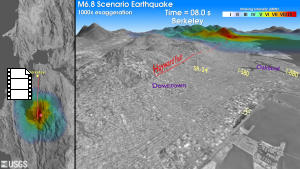
Detailed Perspective Views

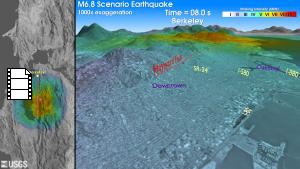
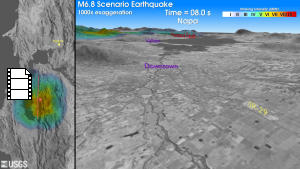
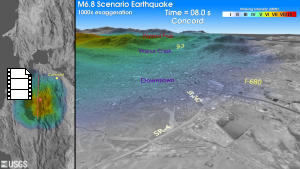
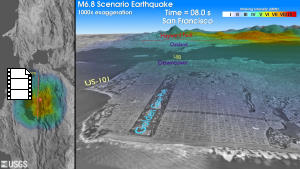
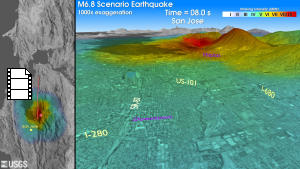
The detailed, perspective views show the ground shaking from a viewpoint two miles (three kilometers) above the earth looking towards each location. In each movie the left panel shows a map view of the area with the fault highlighted in red, the epicenter (location where the rupture starts) identified by the red ball, and the location shown in the right panel labeled in yellow. In the right panel the deformation of the ground associated with the propagation of the seismic waves is exaggerated by a factor of 1000. The topography has been exaggerated by a factor of four to make the hills and mountains more readily visible.
Click on the map to view the normal resolution movie for that location. HD versions are available below.
The ground moves about 6-12 inches (0.2-0.3 m) at locations close to the fault. The ground also moves about 12 inches (0.3 m) in Livermore.
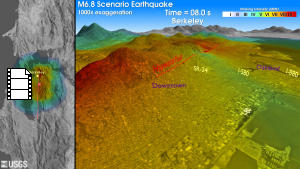
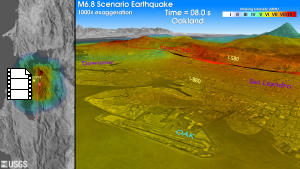
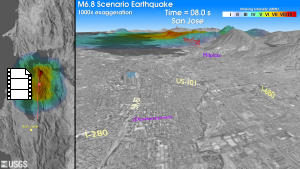
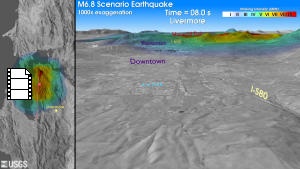
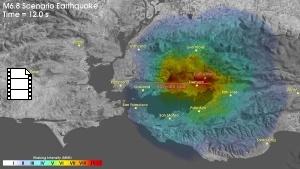
The colors indicate the peak intensity of the shaking up to the current time in the movie at each location. See Explanation of Colors for a more detailed description of the color scheme.
The movies are available in two different resolutions. The normal resolution versions are typically 10 MB in size. The high definition (HD) versions are typically 30 MB in size and are best viewed on high resolution displays.
These images and movies are in the public domain and may be used freely. Please credit the U.S Geological Survey.
Hayward Epicenter
Map View
Detailed Perspective Views
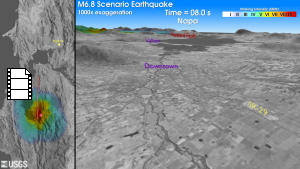
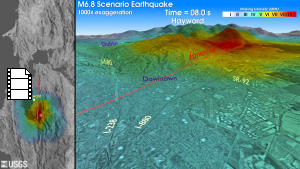
The detailed, perspective views show the ground shaking from a viewpoint two miles (three kilometers) above the earth looking towards each location. In each movie the left panel shows a map view of the area with the fault highlighted in red, the epicenter (location where the rupture starts) identified by the red ball, and the location shown in the right panel labeled in yellow. In the right panel the deformation of the ground associated with the propagation of the seismic waves is exaggerated by a factor of 1000. The topography has been exaggerated by a factor of four to make the hills and mountains more readily visible.
Click on the map to view the normal resolution movie for that location. HD versions are available below.
The ground moves about 6-12 inches (0.2-0.3 m) at locations close to the fault. The ground also moves about 12 inches (0.3 m) in Livermore.
The colors indicate the peak intensity of the shaking up to the current time in the movie at each location. See Explanation of Colors for a more detailed description of the color scheme.
The movies are available in two different resolutions. The normal resolution versions are typically 10 MB in size. The high definition (HD) versions are typically 30 MB in size and are best viewed on high resolution displays.
These images and movies are in the public domain and may be used freely. Please credit the U.S Geological Survey.
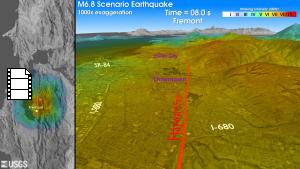
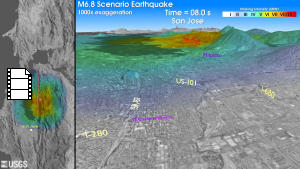
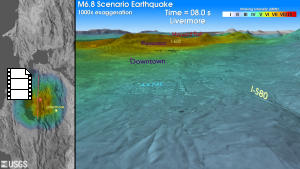
Fremont Epicenter
Map View
Detailed Perspective Views
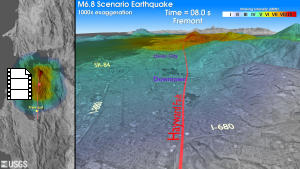
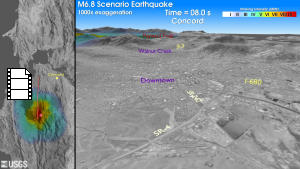
The detailed, perspective views show the ground shaking from a viewpoint two miles (three kilometers) above the earth looking towards each location. In each movie the left panel shows a map view of the area with the fault highlighted in red, the epicenter (location where the rupture starts) identified by the red ball, and the location shown in the right panel labeled in yellow. In the right panel the deformation of the ground associated with the propagation of the seismic waves is exaggerated by a factor of 1000. The topography has been exaggerated by a factor of four to make the hills and mountains more readily visible.
Click on the map to view the normal resolution movie for that location. HD versions are available below.
The ground moves about 6-12 inches (0.2-0.3 m) at locations close to the fault. The ground also moves about 12 inches (0.3 m) in Livermore.
The colors indicate the peak intensity of the shaking up to the current time in the movie at each location. See Explanation of Colors for a more detailed description of the color scheme.
The movies are available in two different resolutions. The normal resolution versions are typically 10 MB in size. The high definition (HD) versions are typically 30 MB in size and are best viewed on high resolution displays.
These images and movies are in the public domain and may be used freely. Please credit the U.S Geological Survey.
« Back