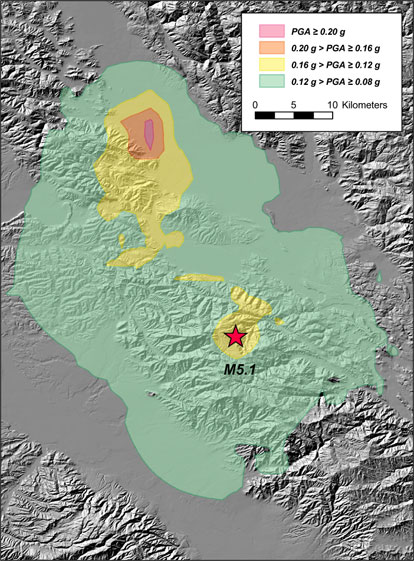
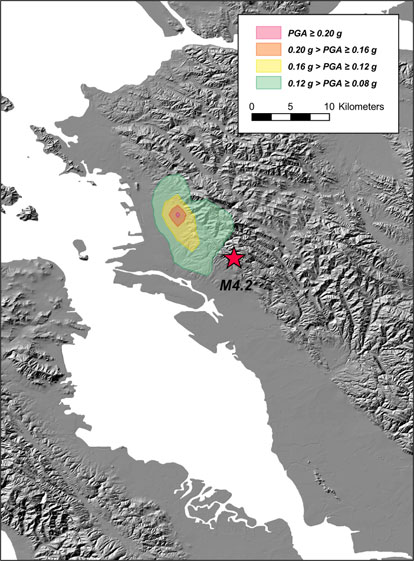
Earthquake directivity is the focusing of wave energy along the fault in the direction of rupture. This means that, exclusive of local site conditions such as soft soil, the stronger ground motions (and damage, if the earthquake is large enough) will be distributed in an elongated pattern centered along the axis of the fault. In other words, distance to the fault is not the only consideration for ground motion amplitude: direction is also important. When a fault ruptures unilaterally (with the epicenter at or near one end of the fault break), the radiated waves are stronger in one direction along the fault.
Directivity is caused by the constructive interference (piling up) of the S-waves, due to the rupture propagation. The above sketch shows a map view of a right-lateral strike slip fault. The blue line represents the surface projection of the rupture. The red star is the epicenter and the magenta arrows show the direction of horizontal slip. A real fault is a plane, not a line, that may extend 10-15 deep for California earthquakes. To keep the discussion simple, we ignore depth and we discuss only the horizontal component of rupture. However, usually there is some vertical component to the rupture: some small earthquakes rupture directly updip.
To understand directivity, picture the earthquake as a series of small earthquakes, moving outward from the epicenter (the epicenter is the point on the Earth's surface above the initial rupture.)
In this sketch, the asterisks represent the epicenters of these small sub-events or rupture pieces. The magenta arrows move along the fault, from imagined epicenter to imagined epicenter, representing rupture along the fault. As the S-waves from each epicenter travel along the fault, they are reinforced by waves generated by the newly ruptured segments. The closer the rupture velocity is to the S-wave velocity, the more the waves reinforce each other, and the stronger the directivity. (Rupture velocities in moderate earthquakes are commonly estimated to be between 50 and 85 percent of S-wave velocity.)
On the “Rupture Directions for Selected Northern California Earthquakes” pages, we have analyzed recordings of peak strong motions, both velocity and acceleration, and back-calculated directivity, both the vector (3-D direction) and the rupture velocity.