10/20/2011 14:41 PDT
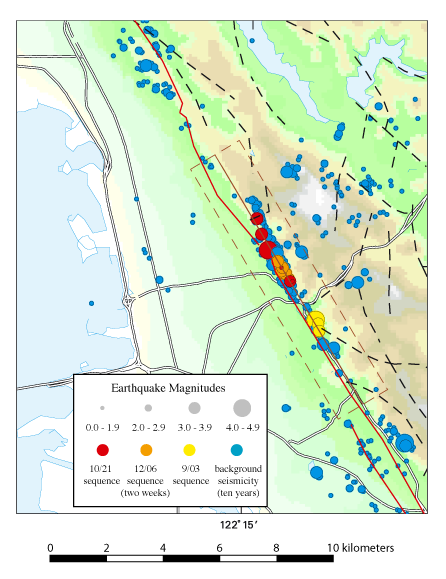
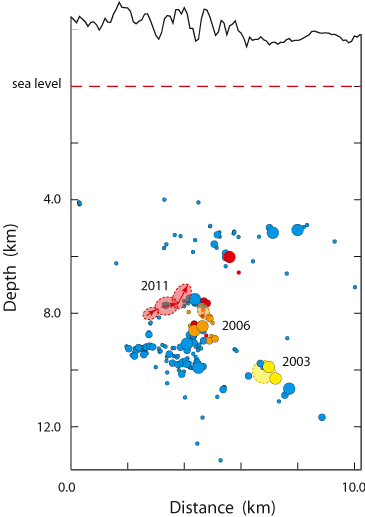
The first figure below is a map, the second is a cross-section. The map shows the epicenters and magnitudes of the October 2011 swarm (red circles), the December 2006 swarm (orange circles), the September 2003 sequence (yellow circles), and 10 years of background seismicity (blue circles). The red lines are mapped faults, and the colored background indicates elevation. The dashed brown lines contain the earthquakes whose hypocenters are plotted as a function of depth and distance along strike in the cross-section. The shaded ellipses approximate the rupture areas of the earthquakes, as inferred from their magnitude and their PGA and PGV rupture directivities. The rupture area of the September 2003 M3.9 is drawn as a shaded circle without a rupture direction because the directivity was not resolved onto the Hayward fault. The three large events of the October swarm rupture in sequence to the northwest, but the rupture directions of the three events are in the reverse direction, that is, to the southeast. The shallow M3.1 earthquake occurred on 11/05/2011.
« Back to directivity plot for this event