08/27/2011 00:18 PDT
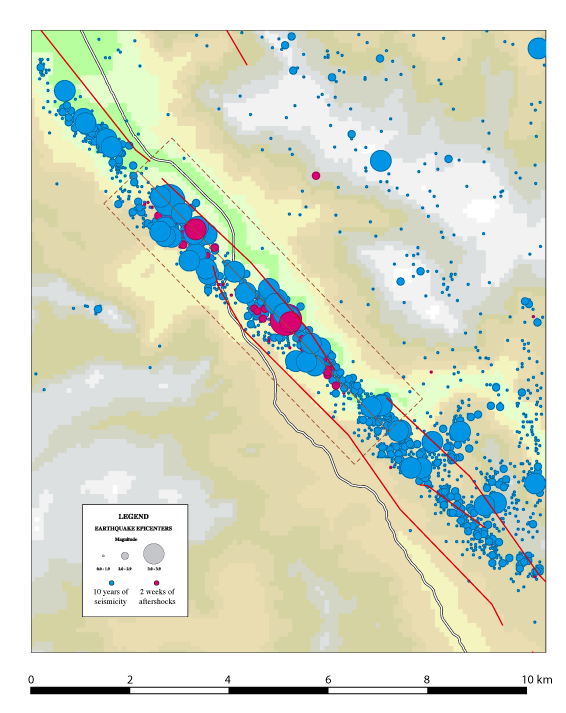
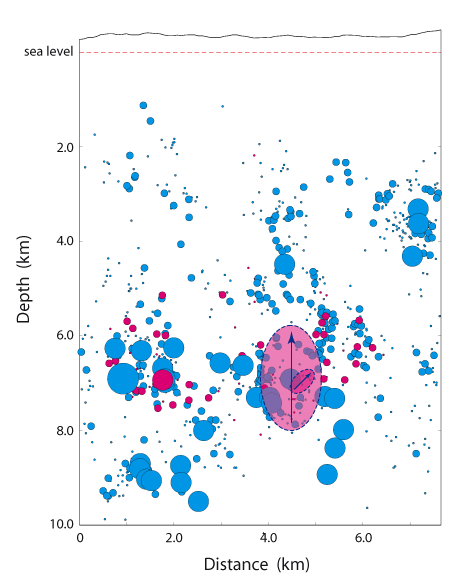
The first figure below is a map, the second is a cross-section. The map shows the epicenters and magnitudes of the Pinnacles main shock (large shaded ellipse), two weeks of aftershocks (smaller magenta circles), and 10 years of background seismicity (blue circles). The red lines are mapped faults, and the colored background indicates elevation. The dashed brown lines contain the earthquakes whose hypocenters are plotted as a function of depth and distance along strike in the cross-section. The dashed ellipses approximate the rupture areas of the main shock and M3.6 aftershock, as inferred from the PGA and PGV rupture directivities and the earthquake magnitudes. Although the main shock rupture area fits within the aftershock distribution, the aftershocks do not mark the rupture boundary and extend 4 km to the northwest. The extended distribution of aftershocks may result from the aseismic behavior of the San Andreas Fault in the "creeping section.".
« Back to directivity plot for this event