01/12/2011 00:51 PST
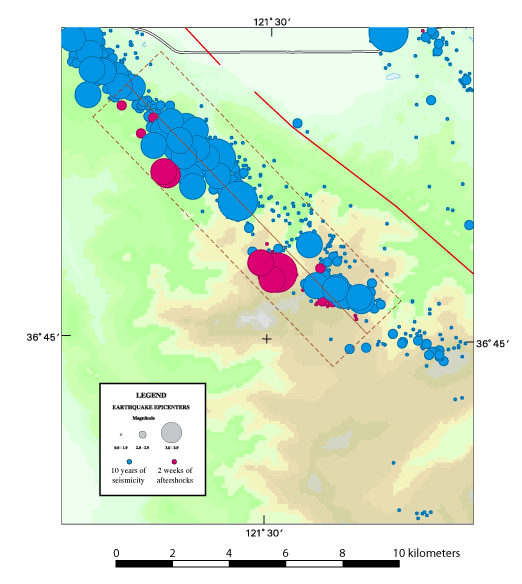
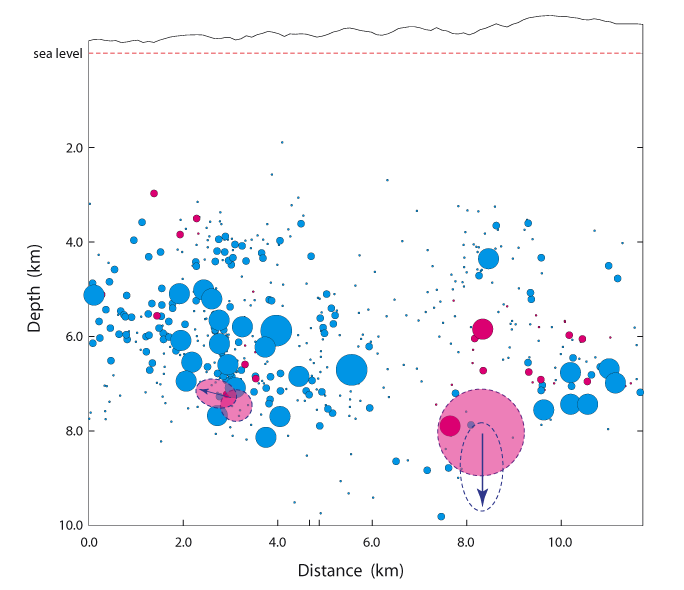
The first figure below is a map, the second is a cross-section. The map shows the epicenters and magnitudes of the San Juan Bautista main shock (large shaded ellipse), two weeks of aftershocks (smaller magenta circles), and 10 years of background seismicity (blue circles). The red lines are mapped faults, and the colored background indicates elevation. The dashed brown lines contain the earthquakes whose hypocenters are plotted as a function of depth and distance along strike in the cross-section. The dashed circles and ellipses approximate the rupture areas of the main shock and two large aftershocks, as inferred from the PGA and PGV rupture directivities and the earthquake magnitudes. The downdip rupture direction obtained for the main shock does not correspond with the seismic gap evident to the northwest. The shaded circles drawn around the main shock and the M3.7 aftershock show the rupture areas estimated without inverting for the directivity, The two large aftershocks are located significantly to the northwest of the main shock: the rupture directivity of the M3.9 aftershock is well constrained.
« Back to directivity plot for this event