06/06/2008 02:02 PDT
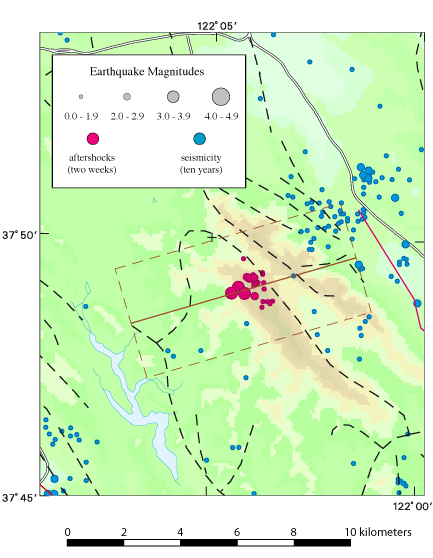
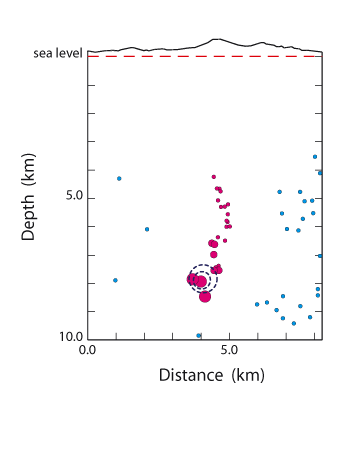
The first figure below is a map, the second is a cross-section. The map shows the epicenters and magnitudes of the Alamo foreshock and main shock (large magenta circles), two weeks of aftershocks (smaller magenta circles), and 10 years of background seismicity (blue circles). The red lines are mapped faults, and the colored background indicates elevation. The dashed brown lines contain the earthquakes whose hypocenters are plotted as a function of depth and distance along strike in the cross-section. The small dashed ellipse approximates the rupture area of the earthquake, as inferred from the PGA rupture directivity and the M3.5 magnitude. The larger ellipse corresponds to the rupture area for a M4.0 magnitude earthquake. Although the aftershock sequence lies in the inferred rupture direction (updip and northeast), the aftershocks extend far beyond the credible rupture area for this small earthquake.
« Back to directivity plot for this event