10/30/2007 20:04 PDT
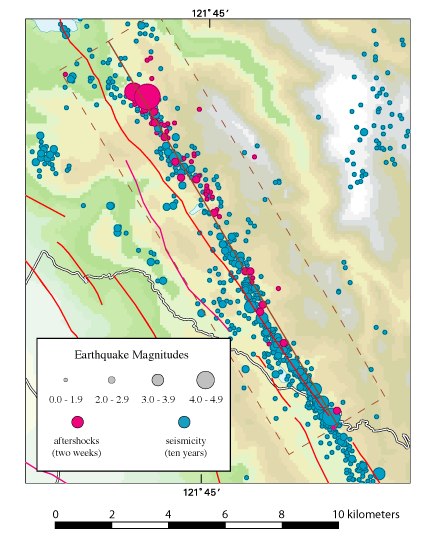
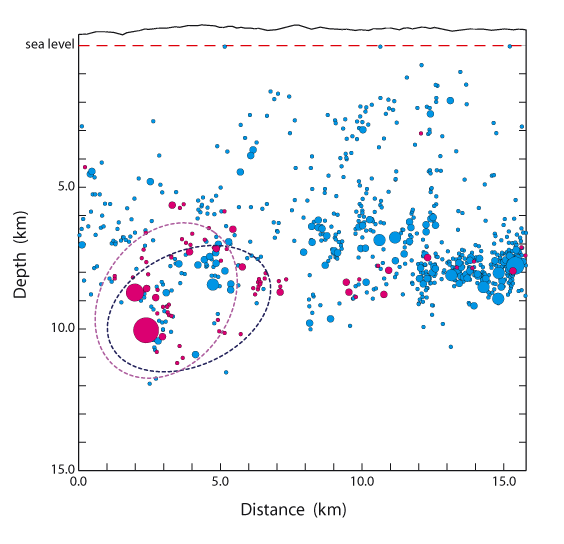
The first figure below is a map, the second is a cross-section. The map shows the epicenters and magnitudes of the Alum Rock main shock (large magenta circle), two weeks of aftershocks (smaller magenta circles), and 10 years of background seismicity (blue circles). The red lines are mapped faults, and the colored background indicates elevation. The dashed brown lines contain the earthquakes whose hypocenters are plotted as a function of depth and distance along strike in the cross-section. The dashed ellipses approximate the rupture area of the earthquake, as inferred from the PGA and PGV rupture directivity and the M5.4 magnitude. For this earthquake, both rupture directions agree well with the offset of the aftershocks.
« Back to directivity plot for this event