03/01/2007 20:40 PST
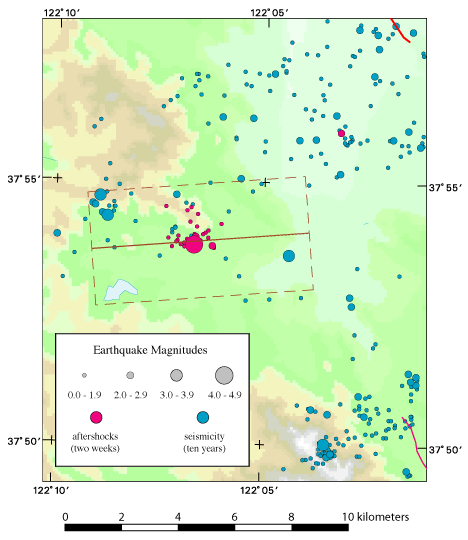
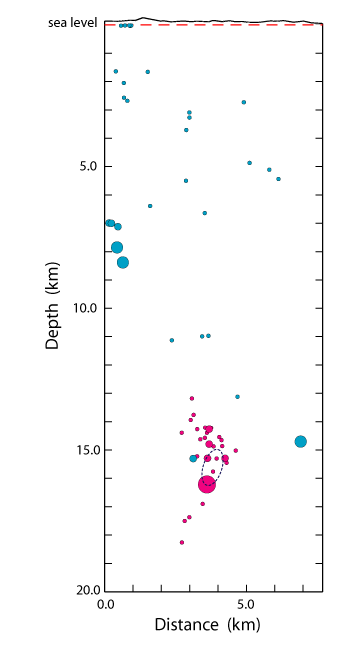
The first figure below is a map, the second is a cross-section. The map shows the epicenters and magnitudes of the Lafayette main shock (large magenta circle), two weeks of aftershocks (smaller magenta circles), and 10 years of background seismicity (blue circles). The red lines are mapped faults, and the colored background indicates elevation. The dashed brown lines contain the earthquakes whose hypocenters are plotted as a function of depth and distance along strike in the cross-section. The dashed dark-blue ellipse approximates the rupture area of the earthquake, as inferred from the PGV rupture directivity and the M4.2 magnitude. For this earthquake, the rupture direction agrees well with the offset of the aftershocks, although the rupture length appears to be ~2 km.
« Back to directivity plot for this event