08/02/2006 20:08 PDT
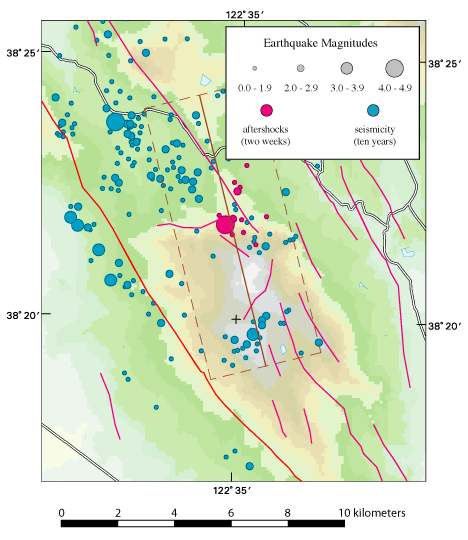
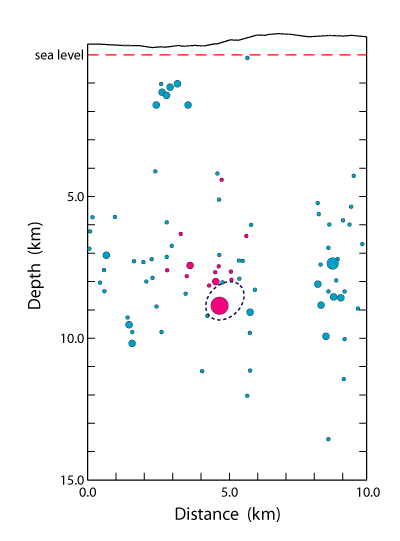
The first figure below is a map, the second is a cross section. The map shows the epicenters and magnitudes of the Glen Ellen main shock (large magenta circle), two weeks of aftershocks (smaller magenta circles), and 10 years of background seismicity (blue circles). The red lines are mapped faults, and the colored background indicates elevation. The dashed brown lines contain the earthquakes whose hypocenters are plotted as a function of depth and distance along strike in the cross-section. The dashed dark-blue ellipse on the cross-section approximates the rupture area of the earthquake, as inferred from the PGV rupture directivity and the M4.4 magnitude. For this earthquake, the aftershock distribution suggests a different rupture direction (updip and to the north) than the directivity inversion.
« Back to directivity plot for this event