Hockley1 Texas
IU HKT commences operations on: 1995,192
| Host | University of Texas Austin |
|---|---|
| Network | IU |
| Latitude | 29.965 |
| Longitude | -95.838 |
| Elevation | -381 |
| Datalogger | Q330-HR |
| Broadband | Streckeisen STS-6A VBB Seismometer |
| Accelerometer | Kinemetrics FBA ES-T EpiSensor Accelerometer |
| Telemetry Status at the NEIC | Pending |
Site


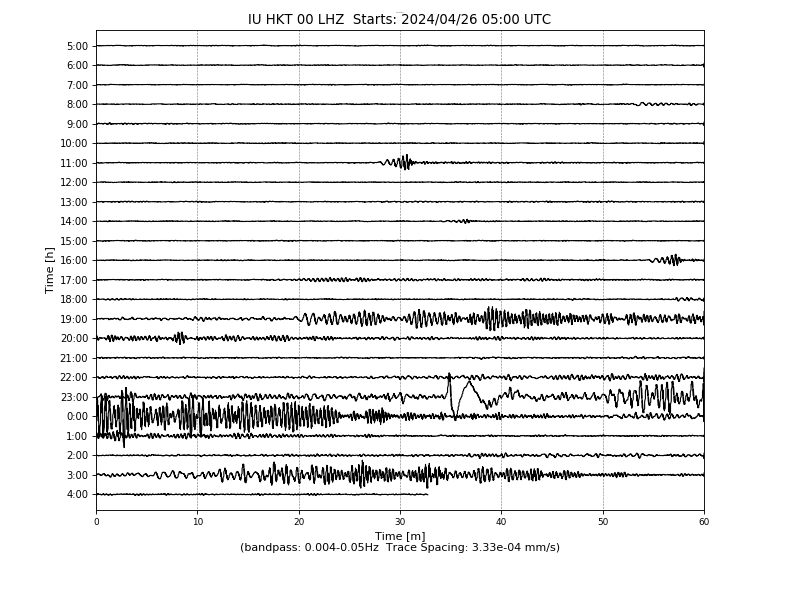
Heliplot
Latency

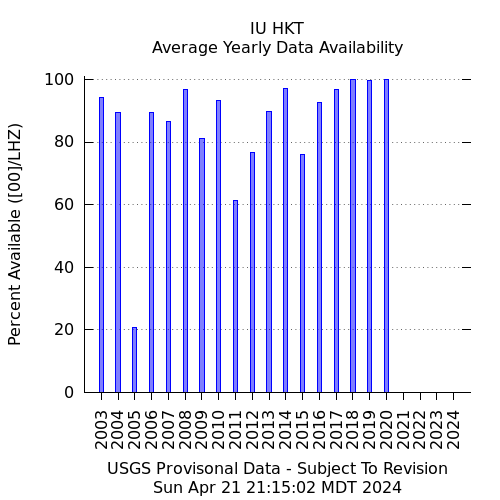
Availability
Past 30 Days

Past 365 Days

Yearly