Seismic Network Operations
IU ADK
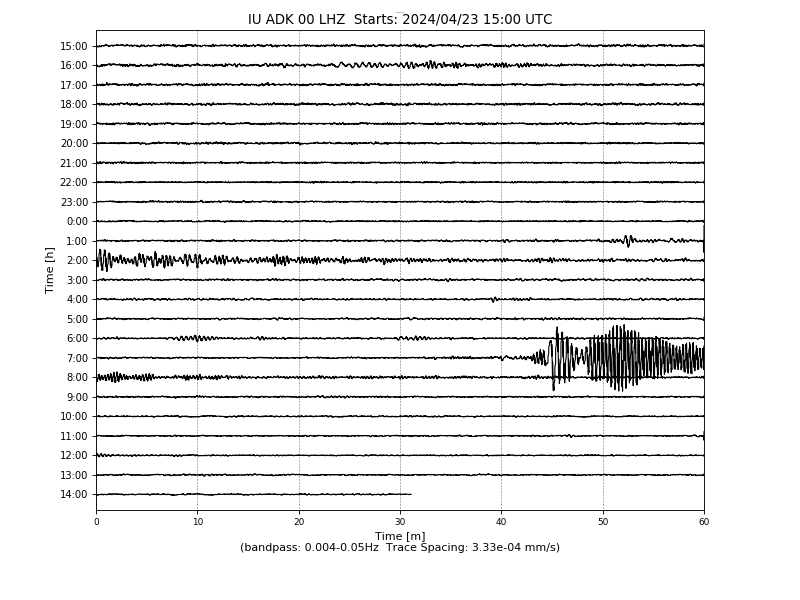
Adak, Aleutian Islands, Alaska
IU ADK commences operations on: 1993,264
| Host: | Aleut Enterprises |
|---|---|
| Latitude: | 51.882 |
| Longitude: | -176.684 |
| Elevation: | 130 |
| Datalogger: | Q330 |
| Broadband: | STS-1VBB_w/E300 |
| Accelerometer: | FBA_ES-T_EpiSensor_Accelerometer |
| Telemetry Status at the NEIC: |
|
Vault Condition: Vault is a small concrete building built into the side of a small rise. The sides and back are covered with earth to height of the roof. Piers are concrete and are separated from the floor and attached to rock.
Site Geology: The Aleutian Islands are of volcanic origin. Bedrock at vault is fractured basalt.
| Location Code | Channel Code | Instrument | Flags | Sample Rate | Dip | Azimuth | Depth |
|---|---|---|---|---|---|---|---|
| 20 | LNZ | FBA ES-T EpiSensor Accelerometer | CG | 1.00 | -90.00 | 0.00 | 0.00 |
| 20 | HNZ | FBA ES-T EpiSensor Accelerometer | TG | 100.00 | -90.00 | 0.00 | 0.00 |
| 10 | VHZ | Trillium 240 broad band | CG | 0.10 | -90.00 | 0.00 | 0.00 |
| 10 | LHZ | Trillium 240 broad band | CG | 1.00 | -90.00 | 0.00 | 0.00 |
| 10 | HHZ | Trillium 240 broad band | TG | 100.00 | -90.00 | 0.00 | 0.00 |
| 10 | BHZ | Trillium 240 broad band | CG | 40.00 | -90.00 | 0.00 | 0.00 |
| 00 | VHZ | STS-1VBB w/E300 | CG | 0.10 | -90.00 | 0.00 | 0.00 |
| 00 | LHZ | STS-1VBB w/E300 | CG | 1.00 | -90.00 | 0.00 | 0.00 |
| 00 | BHZ | STS-1VBB w/E300 | CG | 20.00 | -90.00 | 0.00 | 0.00 |
| 20 | LN2 | FBA ES-T EpiSensor Accelerometer | CG | 1.00 | 0.00 | 90.00 | 0.00 |
| 20 | LN1 | FBA ES-T EpiSensor Accelerometer | CG | 1.00 | 0.00 | 0.00 | 0.00 |
| 20 | HN2 | FBA ES-T EpiSensor Accelerometer | TG | 100.00 | 0.00 | 90.00 | 0.00 |
| 20 | HN1 | FBA ES-T EpiSensor Accelerometer | TG | 100.00 | 0.00 | 0.00 | 0.00 |
| 10 | VH2 | Trillium 240 broad band | CG | 0.10 | 0.00 | 90.00 | 0.00 |
| 10 | VH1 | Trillium 240 broad band | CG | 0.10 | 0.00 | 0.00 | 0.00 |
| 10 | LH2 | Trillium 240 broad band | CG | 1.00 | 0.00 | 90.00 | 0.00 |
| 10 | LH1 | Trillium 240 broad band | CG | 1.00 | 0.00 | 0.00 | 0.00 |
| 10 | HH2 | Trillium 240 broad band | TG | 100.00 | 0.00 | 90.00 | 0.00 |
| 10 | HH1 | Trillium 240 broad band | TG | 100.00 | 0.00 | 0.00 | 0.00 |
| 10 | BH2 | Trillium 240 broad band | CG | 40.00 | 0.00 | 90.00 | 0.00 |
| 10 | BH1 | Trillium 240 broad band | CG | 40.00 | 0.00 | 0.00 | 0.00 |
| 00 | VH2 | STS-1VBB w/E300 | CG | 0.10 | 0.00 | 90.00 | 0.00 |
| 00 | VH1 | STS-1VBB w/E300 | CG | 0.10 | 0.00 | 0.00 | 0.00 |
| 00 | LH2 | STS-1VBB w/E300 | CG | 1.00 | 0.00 | 90.00 | 0.00 |
| 00 | LH1 | STS-1VBB w/E300 | CG | 1.00 | 0.00 | 0.00 | 0.00 |
| 00 | BH2 | STS-1VBB w/E300 | CG | 20.00 | 0.00 | 90.00 | 0.00 |
| 00 | BH1 | STS-1VBB w/E300 | CG | 20.00 | 0.00 | 0.00 | 0.00 |

PDF, Last Month

PDF, Last Year

PDF, Month

PDF, Current Week

PDF, Year

PDF, All

PDF, Last Month

PDF, Last Year

PDF, Month

PDF, Current Week

PDF, Year


Availability, Since 1972

Availability, 2 Month

As part of the annual calibration process, the USGS runs a sequence that includes a random, a step, and several sine wave calibrations. The USGS analyzes the random binary calibration signal in order to estimate the instrument response. The figures below show the results from the analysis of the most recent processed calibration at the station.
We use an iterative three-step method to estimate instrument response parameters (poles, zeros, sensitivity and gain) and their associated errors using random calibration signals. First, we solve a coarse non-linear inverse problem using a least squares grid search to yield a first approximation to the solution. This approach reduces the likelihood of poorly estimated parameters (a local-minimum solution) caused by noise in the calibration records and enhances algorithm convergence. Second, we iteratively solve a non-linear parameter estimation problem to obtain the least squares best-fit Laplace pole/zero/gain model. Third, by applying the central limit theorem we estimate the errors in this pole/zero model by solving the inverse problem at each frequency in a 2/3rds-octave band centered at each best-fit pole/zero frequency. This procedure yields error estimates of the 99% confidence interval.
| Loc | Chan | Cal Date | Epoch-Span | Grade | Amp Nominal Error (dB) | Amp Best Fit Error (dB) | Phase Nominal Error (degree) | Phase Best Fit Error (degree) | Sensor | Cal Type |
|---|---|---|---|---|---|---|---|---|---|---|
| 10 | BHZ | 2013:015 | 2011:264 to No Ending Time | A | 0.011178 | 0.0077 | 0.14201 | 0.087994 | TR240 | Random |
| 00 | BHZ | 2013:014 | 2009:200 to No Ending Time | A | 0.018377 | 0.010582 | 0.12835 | 0.19871 | STS1VBBE3 | Random |
| 00 | BH1 | 2013:014 | 2009:200 to No Ending Time | A | 0.01751 | 0.010736 | 0.12613 | 0.20276 | STS1VBBE3 | Random |
| 00 | BH2 | 2013:014 | 2009:200 to No Ending Time | A | 0.018881 | 0.0088715 | 0.14023 | 0.19495 | STS1VBBE3 | Random |
-
2012-08-07Power and last mile communication link restored fixing an eight month outage.
-
2011-09-24Power systems upgrade completed.
-
2009-07-27Upgraded to Q330 digitizer.

