Did You Feel It? (DYFI) collects information from people who felt an earthquake and creates maps that show what people experienced and the extent of damage.
Report it Here - Tell Us!
Find the earthquake you felt, and then tell us about it. Not in the list?
DYFI, Past 24 Hours
View Map and List of Felt Events
Search and View Past Earthquakes
-
Search DYFI Archives
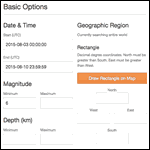
Explore events that include DYFI. Default search retrieves only events with DYFI products from the past 30 days but can be refined to user specifications.
-
Explore the Science Behind DYFI
Explore our collection of citizen science data, report your experience of an earthquake, or learn more about this citizen science project - how it's done, how you can contribute, and what we do with your data.
-
Visualize Yearly DYFI Data

Cumulative and yearly response maps for earthquakes in the U.S. and around the world using an interactive map. Export a map view using the printer icon in top left corner of map.
-
Discover Related Products
DYFI is one of many products that work together to tell a more complete story. Explore products related to DYFI.


